Fig. A.5
Download original image
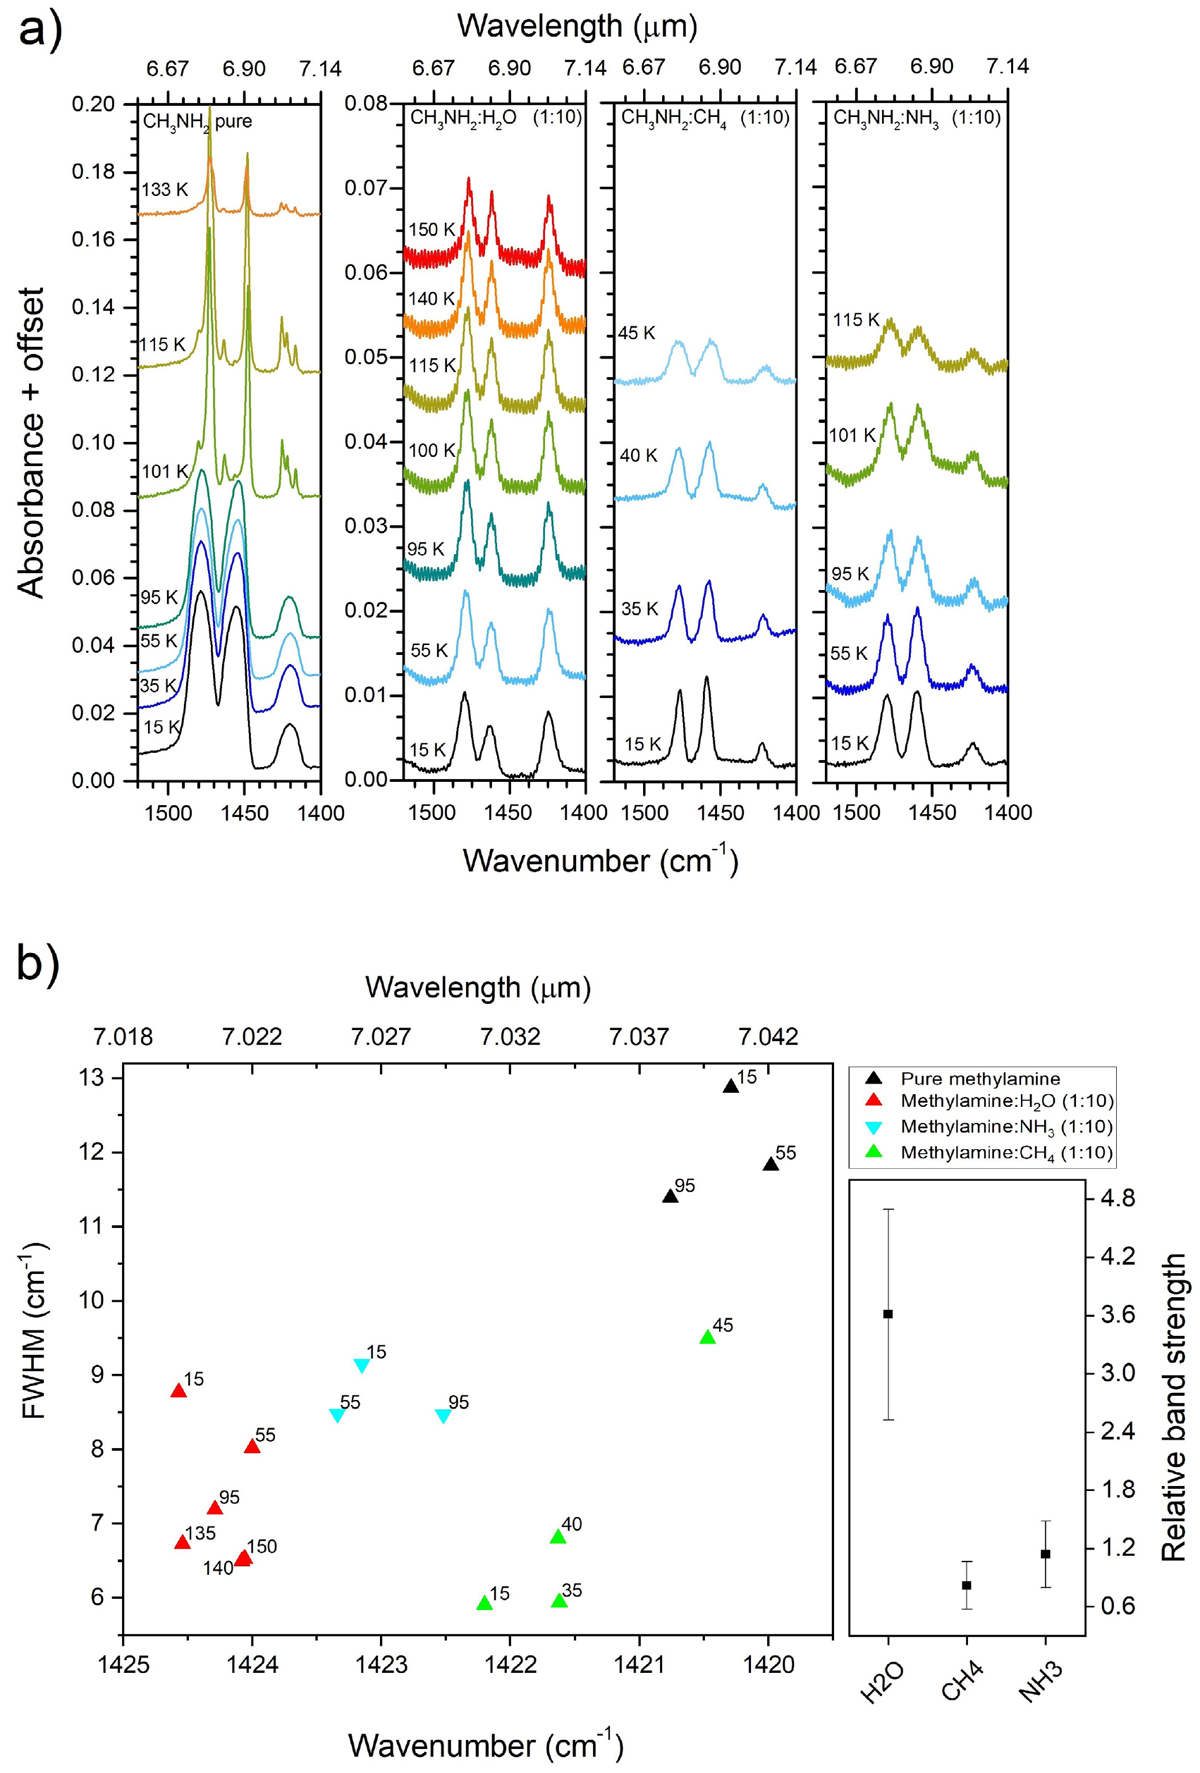
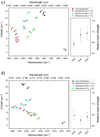
(a) Infrared band profile of the CH3 antisymmetric deformation mode of CH3NH2 (the peaks around 1479 cm−1 and 1455 cm−1) and the CH3 symmetric deformation mode (around 1420 cm−1), in different ices at different temperatures, from left to right: pure CH3NH2, CH3NH2:H2O (1:10), CH3NH2:CH4 (1:10), and CH3NH2:NH3 (1:10). (b) Left panel: peak position vs. FWHM for the CH3 symmetric deformation band in the ice mixtures displayed in a. Different mixtures are indicated by different colors, and the different temperatures are marked in the graph. Right panel: relative band strength of the CH3 symmetric deformation band (1420 cm−1) in different ice mixtures at 15 K. Panels c and d: same as b for the CH3 antisymmetric deformation modes, ν5 and ν12, at 1455 and 1478.6 cm−1, respectively.
Current usage metrics show cumulative count of Article Views (full-text article views including HTML views, PDF and ePub downloads, according to the available data) and Abstracts Views on Vision4Press platform.
Data correspond to usage on the plateform after 2015. The current usage metrics is available 48-96 hours after online publication and is updated daily on week days.
Initial download of the metrics may take a while.