Free Access
Fig. 10
Download original image
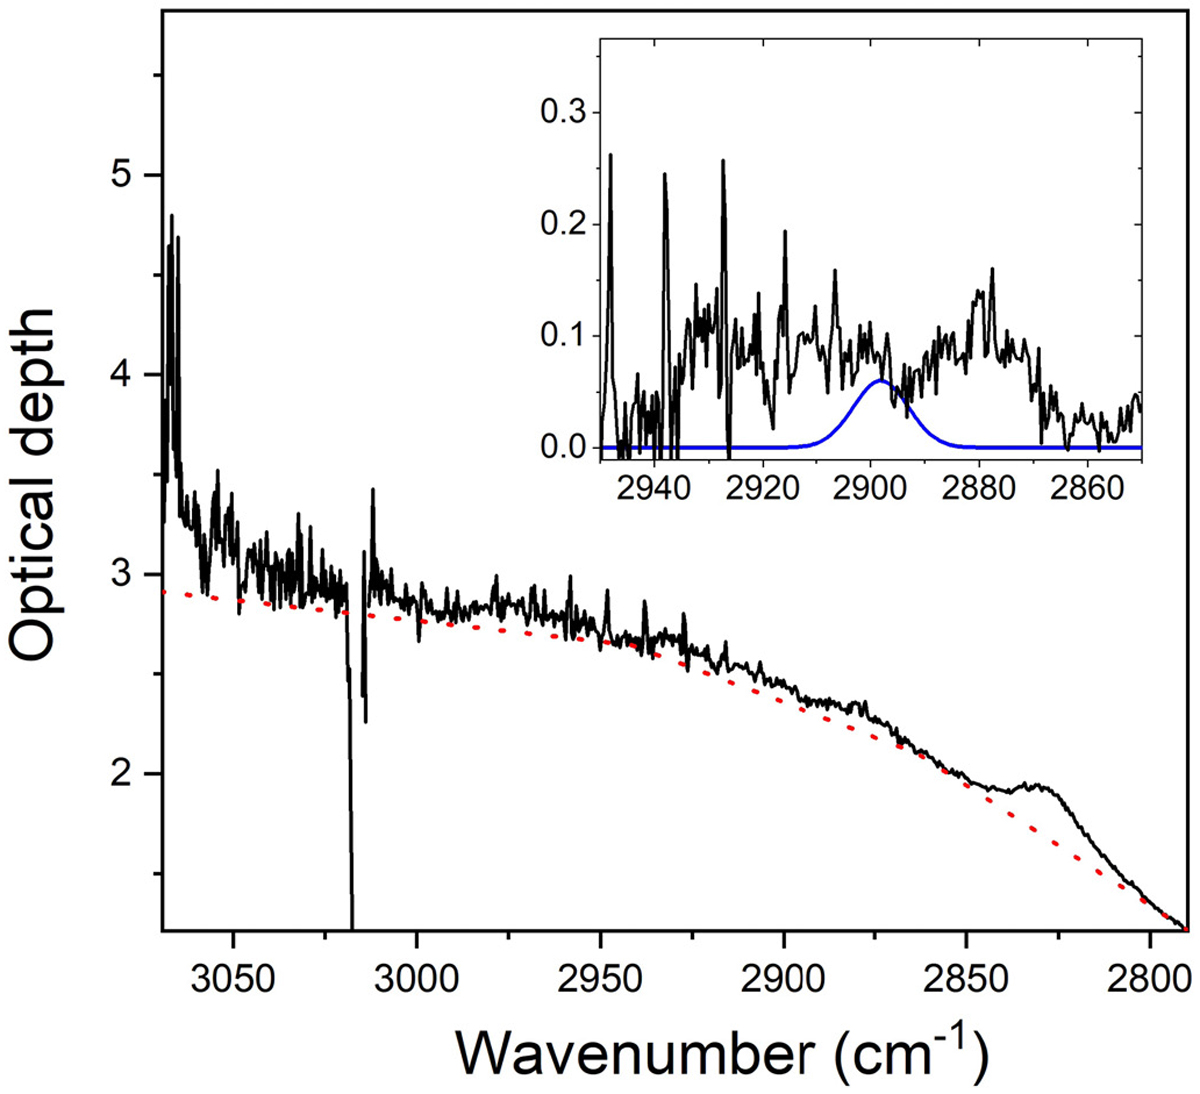
Example of the adjustment of a local baseline in the W33A spectrum (red dotted line). The top right panel shows the subtracted spectra in the 2850–2950 cm−1 region and the adjusted Gaussian feature (blue) expected from CH3NH2 in an H2O matrix.
Current usage metrics show cumulative count of Article Views (full-text article views including HTML views, PDF and ePub downloads, according to the available data) and Abstracts Views on Vision4Press platform.
Data correspond to usage on the plateform after 2015. The current usage metrics is available 48-96 hours after online publication and is updated daily on week days.
Initial download of the metrics may take a while.