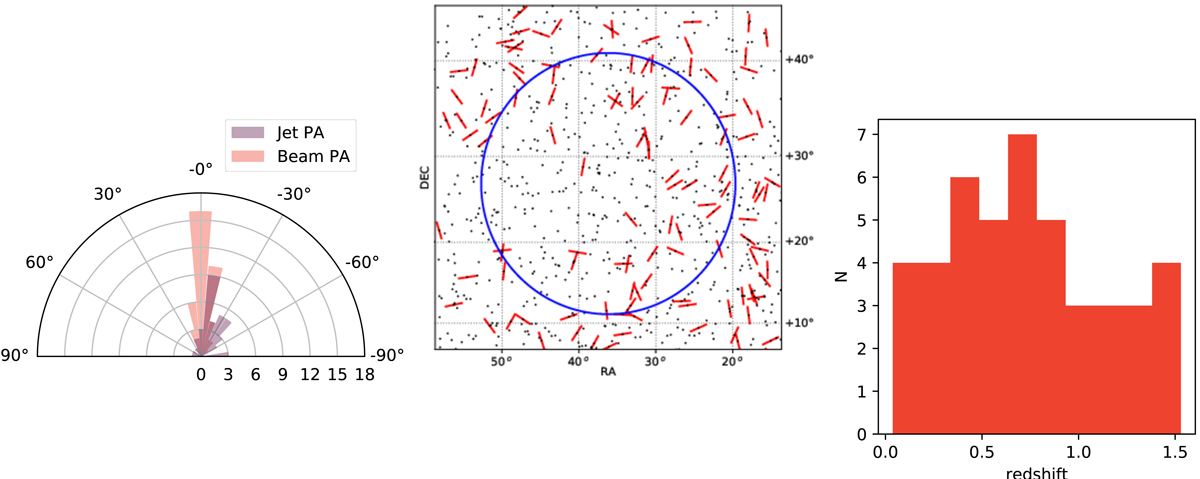
Fig. A.1.
Download original image
Distributions for QJAR1. Left panel: Jet positions angles versus the radio beam orientation. Middle panel: Sky map demonstrating jets orientations (red stripes) in the region vicinity in the corresponding redshift range. Locations of sources outside the redshift range are shown by gray points. Right panel: Distribution of sources over the redshift range.
Current usage metrics show cumulative count of Article Views (full-text article views including HTML views, PDF and ePub downloads, according to the available data) and Abstracts Views on Vision4Press platform.
Data correspond to usage on the plateform after 2015. The current usage metrics is available 48-96 hours after online publication and is updated daily on week days.
Initial download of the metrics may take a while.