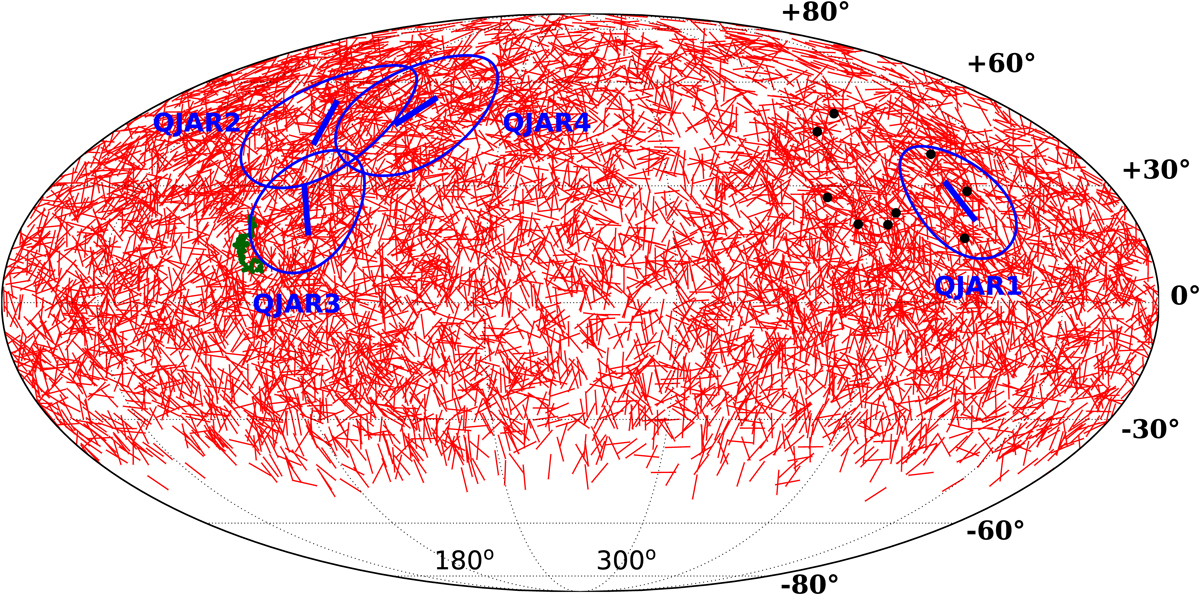
Fig. 4.
Download original image
Positions of the strong-alignment regions QJARs (SL > 5σ) along with the average direction of PAs within each region are plotted with blue. Red segments represent the PA of each source. Green points represent the positions of the members of the Huge-LQG (Clowes et al. 2013). Black points represent the positions of the members of the Giant GRB Ring (Balázs et al. 2015).
Current usage metrics show cumulative count of Article Views (full-text article views including HTML views, PDF and ePub downloads, according to the available data) and Abstracts Views on Vision4Press platform.
Data correspond to usage on the plateform after 2015. The current usage metrics is available 48-96 hours after online publication and is updated daily on week days.
Initial download of the metrics may take a while.