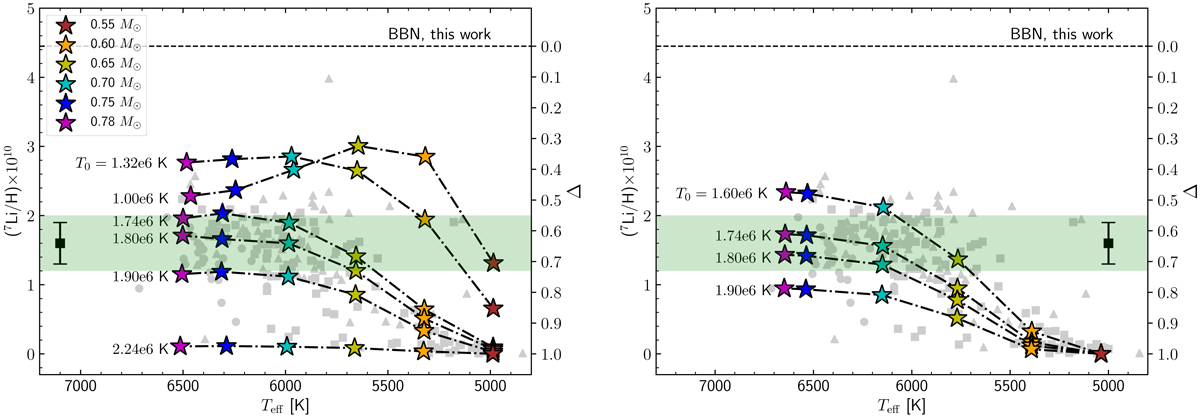
Fig. 4.
Download original image
Lithium abundance according to the effective temperature for Montréal/Montpellier models (model set 1, left panel) and CESTAM models (model set 2, right panel) at 12.5 Gyr, taking into account different T0 values for the parameterized turbulent diffusion coefficient. The corresponding Δ values are shown on the right y-axis. The gray symbols are observed lithium abundances from Sbordone et al. (2010) (circles), Bonifacio & Molaro (1997) (triangles), and the SAGA database (http://sagadatabase.jp/, Suda et al. 2008, 2011; Yamada et al. 2013; Suda et al. 2017) (squares). The black square with error bars represents the standard value for the lithium plateau (Sbordone et al. 2010). The green area represents the range of Δ values found in Sect. 3.
Current usage metrics show cumulative count of Article Views (full-text article views including HTML views, PDF and ePub downloads, according to the available data) and Abstracts Views on Vision4Press platform.
Data correspond to usage on the plateform after 2015. The current usage metrics is available 48-96 hours after online publication and is updated daily on week days.
Initial download of the metrics may take a while.