Fig. 3.
Download original image
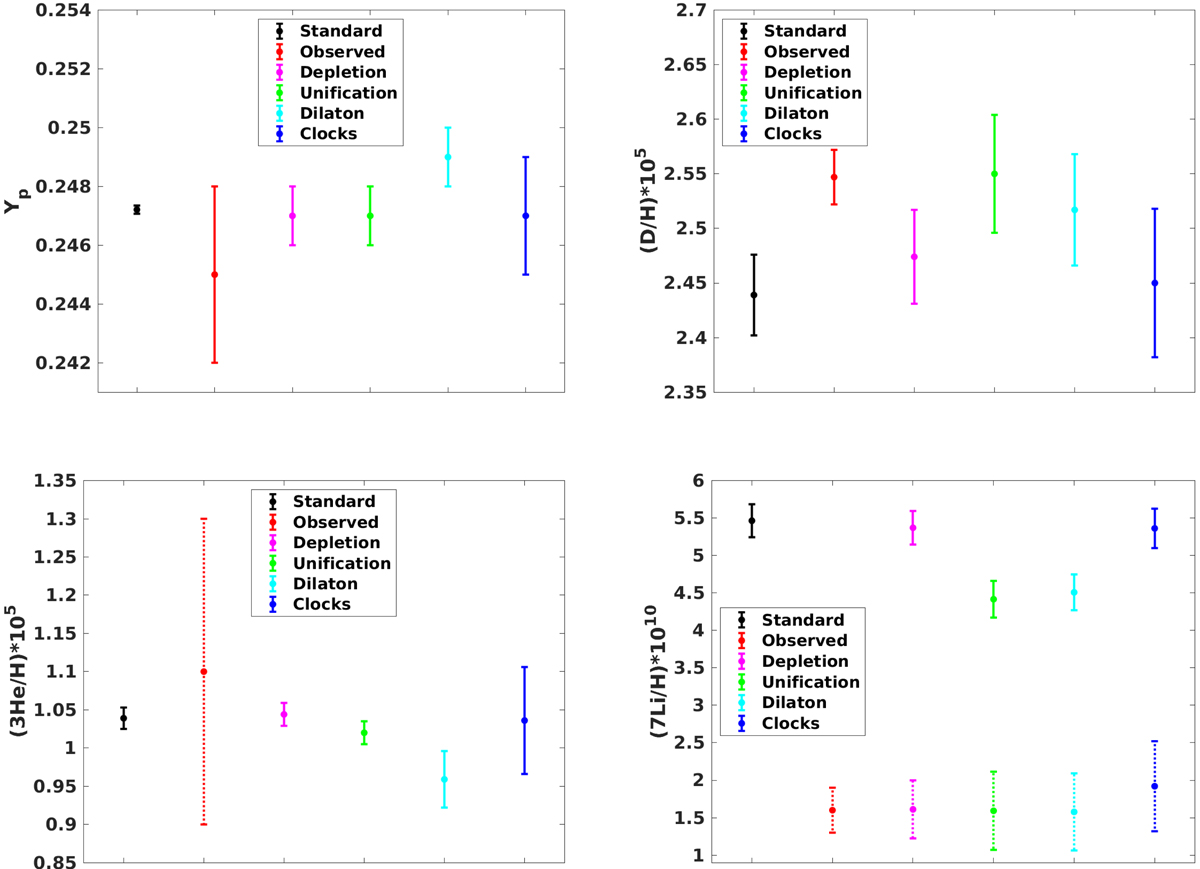
Graphical comparison of the data in Tables 1 and 5 for each of the four nuclides. In each panel the black points are the standard theoretical values of Pitrou et al. (2021), and the red points are the observed abundances. They are listed in Table 1. The magenta points show the best-fit depletion-only model discussed in Sect. 2, and the green, cyan, and blue points are the best fit in the Unification, Dilaton, and Clocks cases discussed in Table 5. The 1-σ uncertainties are depicted in all cases. The lithium-7 panel depicts both the cosmological and astrophysical (depleted) abundances; the latter and the helium-3 observed abundance are shown with dotted error bars to indicate that they are not cosmological.
Current usage metrics show cumulative count of Article Views (full-text article views including HTML views, PDF and ePub downloads, according to the available data) and Abstracts Views on Vision4Press platform.
Data correspond to usage on the plateform after 2015. The current usage metrics is available 48-96 hours after online publication and is updated daily on week days.
Initial download of the metrics may take a while.