Fig. 9
Download original image
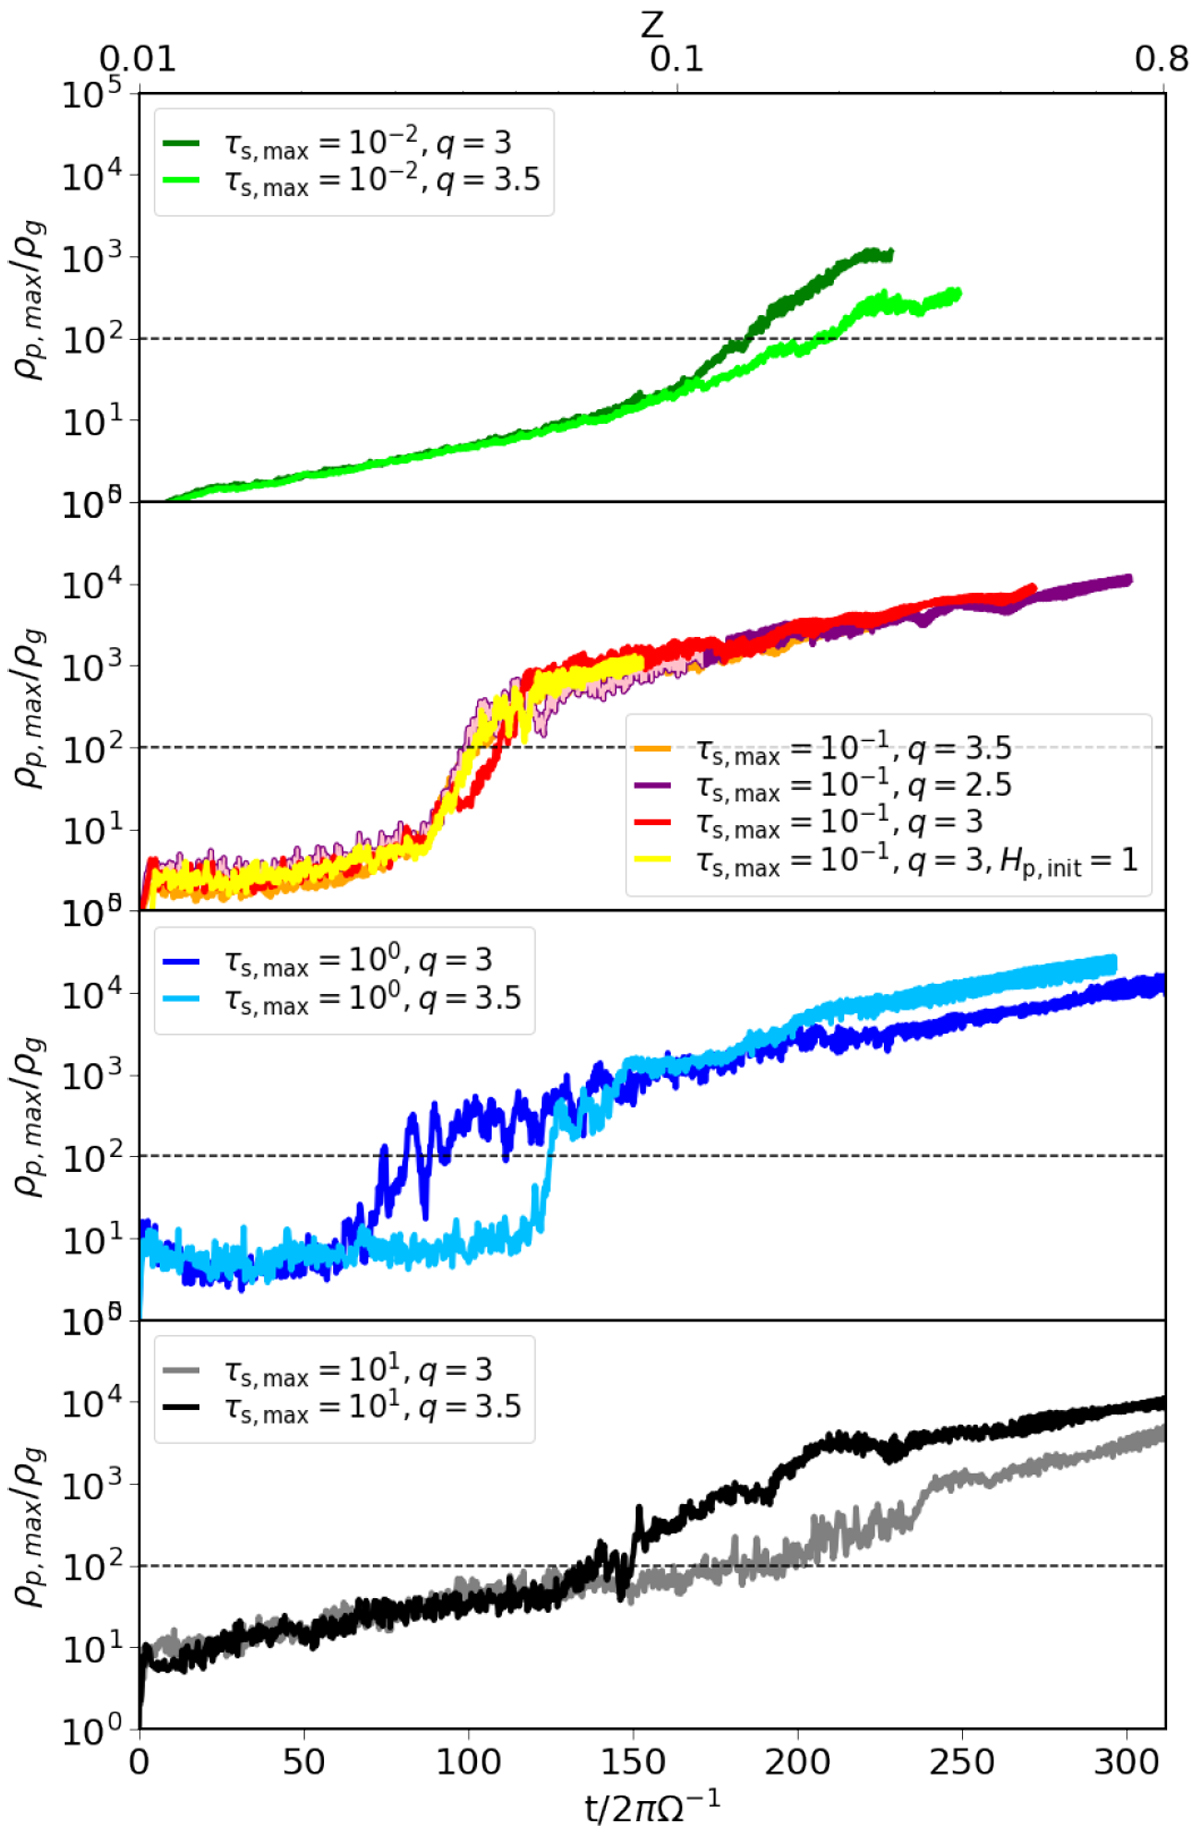
Maximum solid density evolution as a function of time comparing the effect of the size distribution exponents and the particle size ranges given Np = 70 per cell. The initial particle scale height is Hp,init = 0.015Hg, except in thecase of the yellow curve, where Hp,init = 1Hg. The metallicity is shown on the top axis. The dashed line corresponds to ρp,max ∕ρg = 100, which represents our assumed threshold for solid clumping. Independent of q, the maximum solid density evolves similarly in the first, second and last panels until the critical metallicity limit is reached. Given that τs,max = 100 however, there is a deviation of about 50 orbits between the time of filament formation, depending on whether q = 3 or q = 3.5. There is also no clear trend on how ρp,max∕ρg changes as both a function of q and τs,max.
Current usage metrics show cumulative count of Article Views (full-text article views including HTML views, PDF and ePub downloads, according to the available data) and Abstracts Views on Vision4Press platform.
Data correspond to usage on the plateform after 2015. The current usage metrics is available 48-96 hours after online publication and is updated daily on week days.
Initial download of the metrics may take a while.