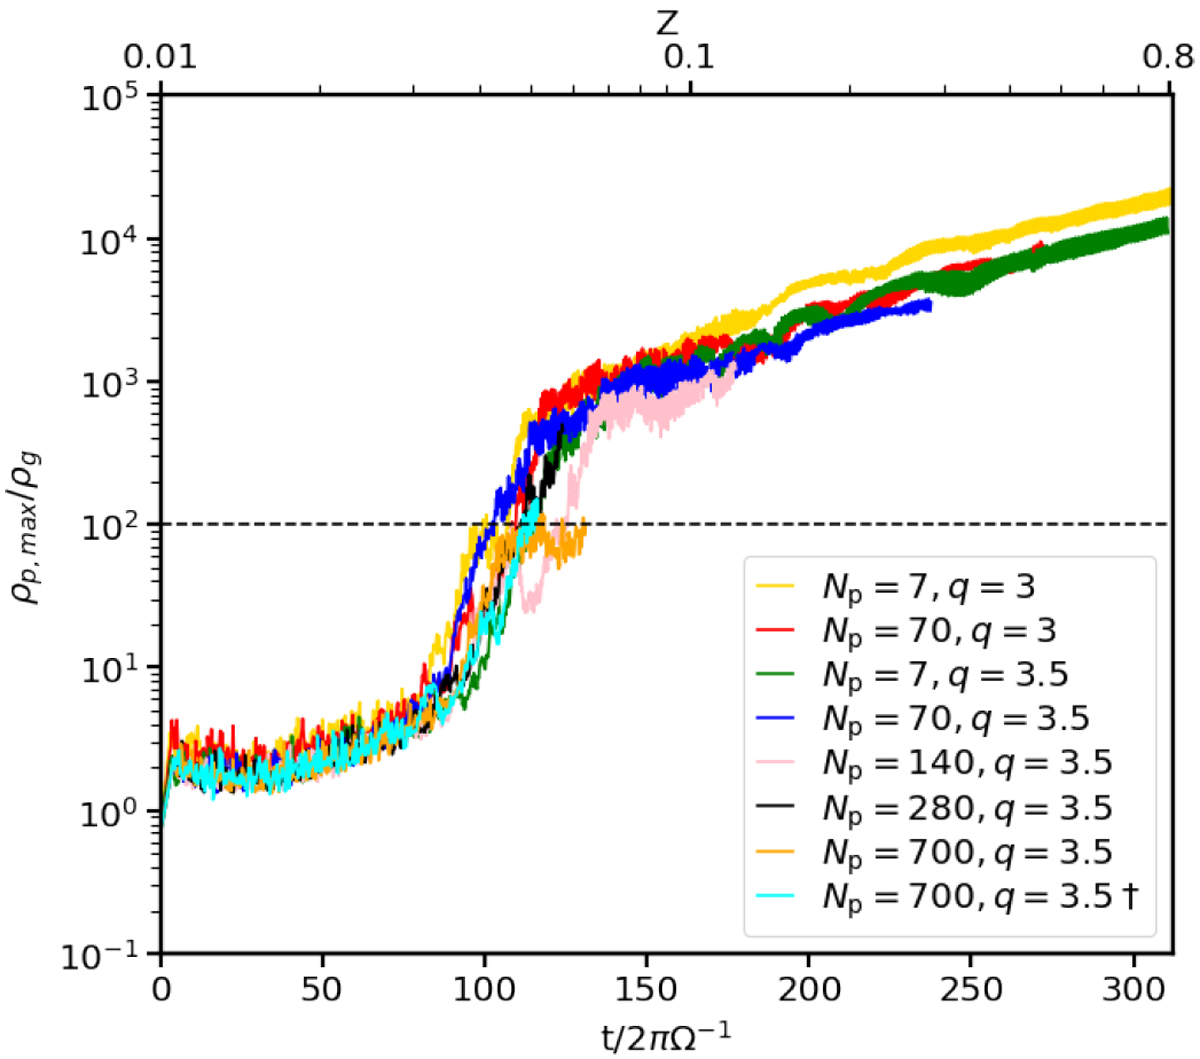
Fig. 6
Download original image
Maximum solid density evolution as a function of time comparing the effect of particle number for runs with τs = 10−3−10−1 and q = 3, q = 3.5. The dagger symbol notes the model where we initialized the particle position with a different randomization than that of the system corresponding to the orange curve, with the same particle number. The metallicity is shown on the top axis. The dashed line corresponds to ρp,max ∕ρg = 100, which represents the limit of solid clumping. All curves show similar trends, independent of the particle number and the slope of the solid size distribution.
Current usage metrics show cumulative count of Article Views (full-text article views including HTML views, PDF and ePub downloads, according to the available data) and Abstracts Views on Vision4Press platform.
Data correspond to usage on the plateform after 2015. The current usage metrics is available 48-96 hours after online publication and is updated daily on week days.
Initial download of the metrics may take a while.