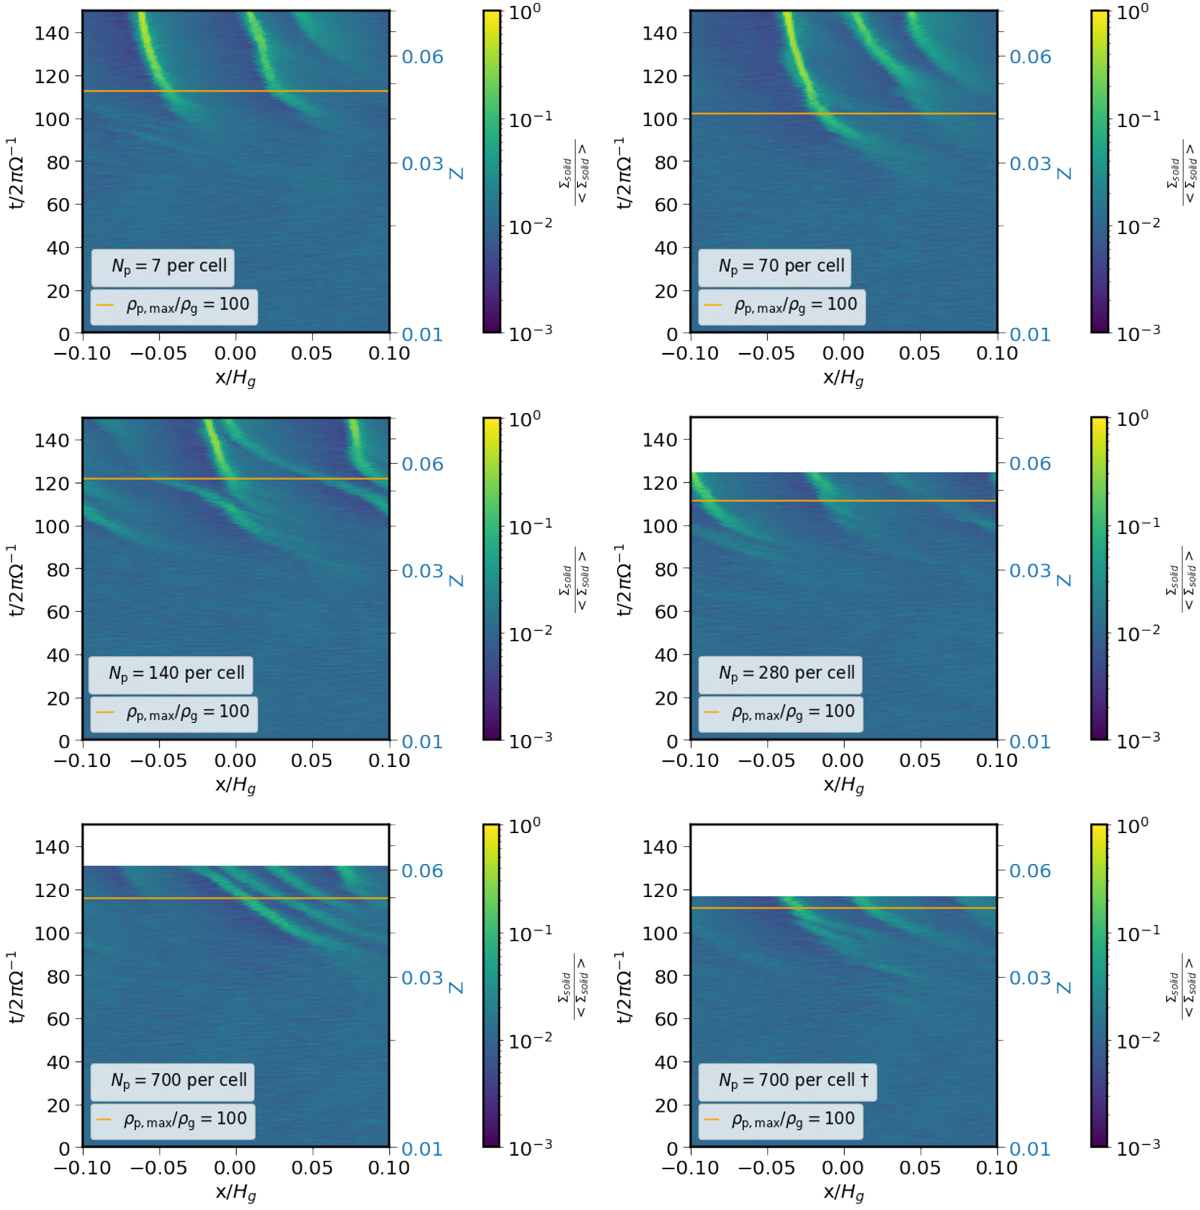
Fig. 5
Download original image
Space-time plots showing the solid surface density for runs with q = 3.5, τs = 10−3−10−1 and Np = 7, 70, 140, 280 vs. 700 per cell. The last panel, indicated with a dagger, corresponds to the run where Np = 700 per cell and the particles are initialized with a different randomization as in our nominal 700 per cell model, shown on the left-hand side of the last row. The orange line marks the limit of threshold metallicity, Zcrit, where ρp,max∕ρg = 100. The y-axis on the right-hand side shows the metallicity, Z. In all four systems, the critical metallicity is reached after about 100–120 orbits, signifying that increasing the particle number does not make the multispecies streaming instability less efficient in forming filaments.
Current usage metrics show cumulative count of Article Views (full-text article views including HTML views, PDF and ePub downloads, according to the available data) and Abstracts Views on Vision4Press platform.
Data correspond to usage on the plateform after 2015. The current usage metrics is available 48-96 hours after online publication and is updated daily on week days.
Initial download of the metrics may take a while.