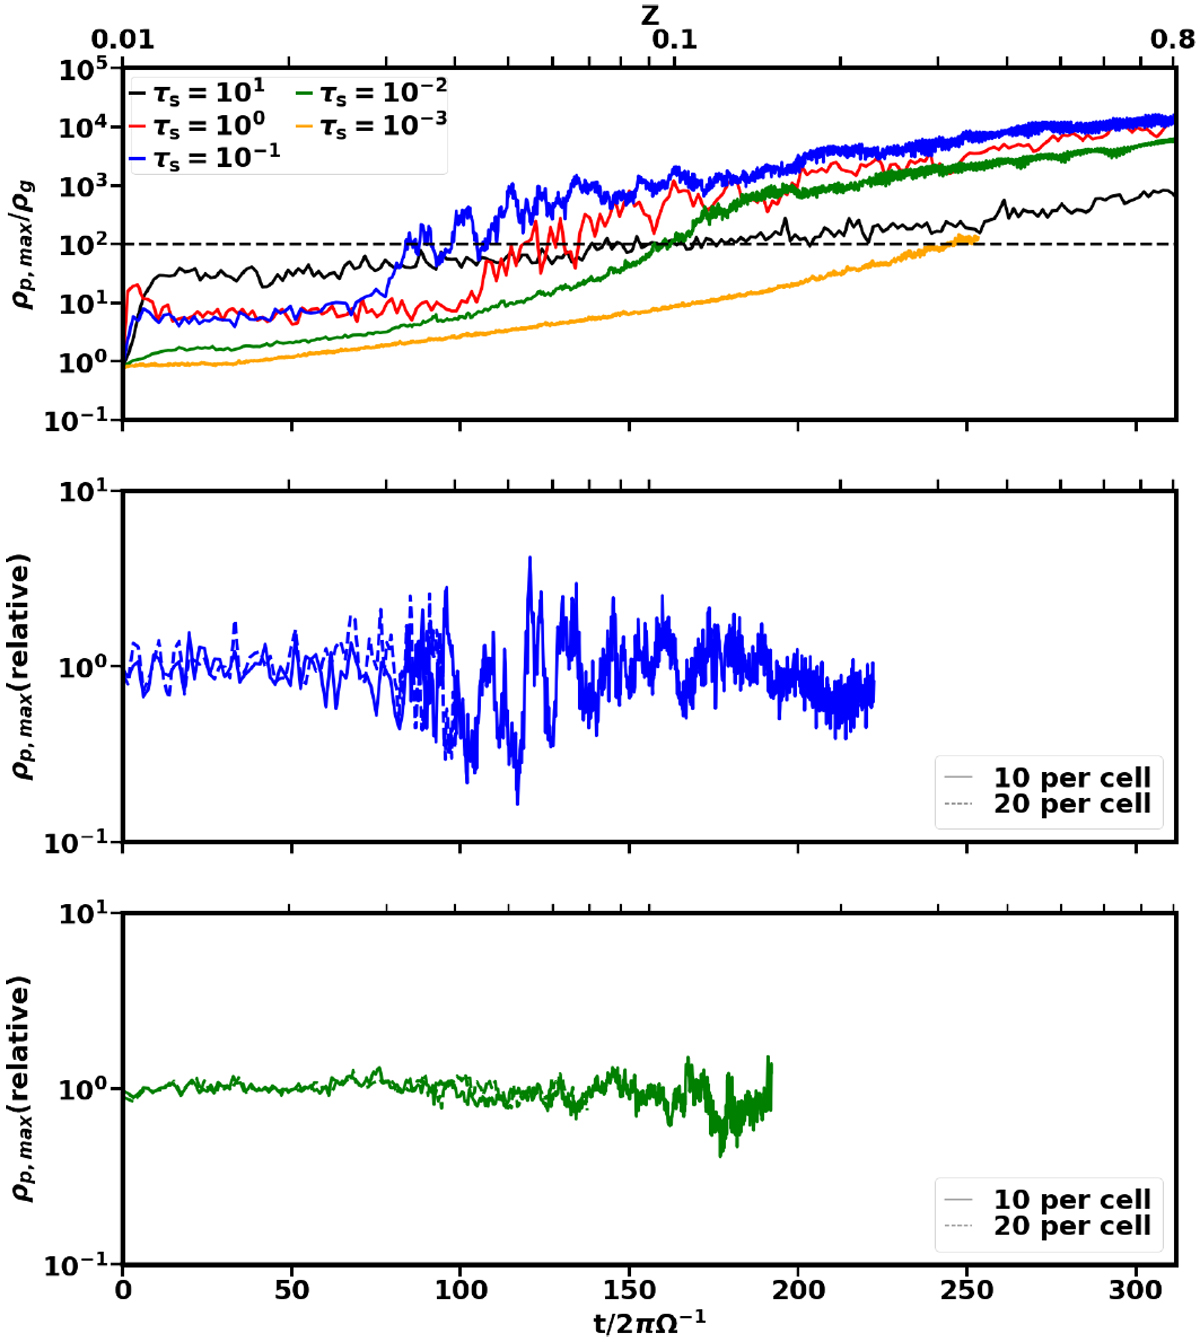
Fig. 1
Download original image
Top panel: maximum solid density evolution as a function of time for single species runs with τs = 10−3, 10−2, 10−1, 100 and 101. The metallicity is shown on the top axis. The horizontal black dashed line corresponds to ρp,max ∕ρg = 100, which represents our adopted metallicity threshold for filament formation. Middle and bottom panels: Effect of changes in Np for τs = 10−1 and 10−2, respectively.Here, the solid lines show the relative maximum density for 10 vs. 20 particles per cell while the dashed lines show the relative maximum density for 10 vs. 100 particles per cell. In both cases, the level of deviation from unity is low, implying that the particle number does not have a significant effect on the maximum density of the single-species streaming instability. The colors correspond to the legend in the top panel.
Current usage metrics show cumulative count of Article Views (full-text article views including HTML views, PDF and ePub downloads, according to the available data) and Abstracts Views on Vision4Press platform.
Data correspond to usage on the plateform after 2015. The current usage metrics is available 48-96 hours after online publication and is updated daily on week days.
Initial download of the metrics may take a while.