Free Access
Fig. 9.
Download original image
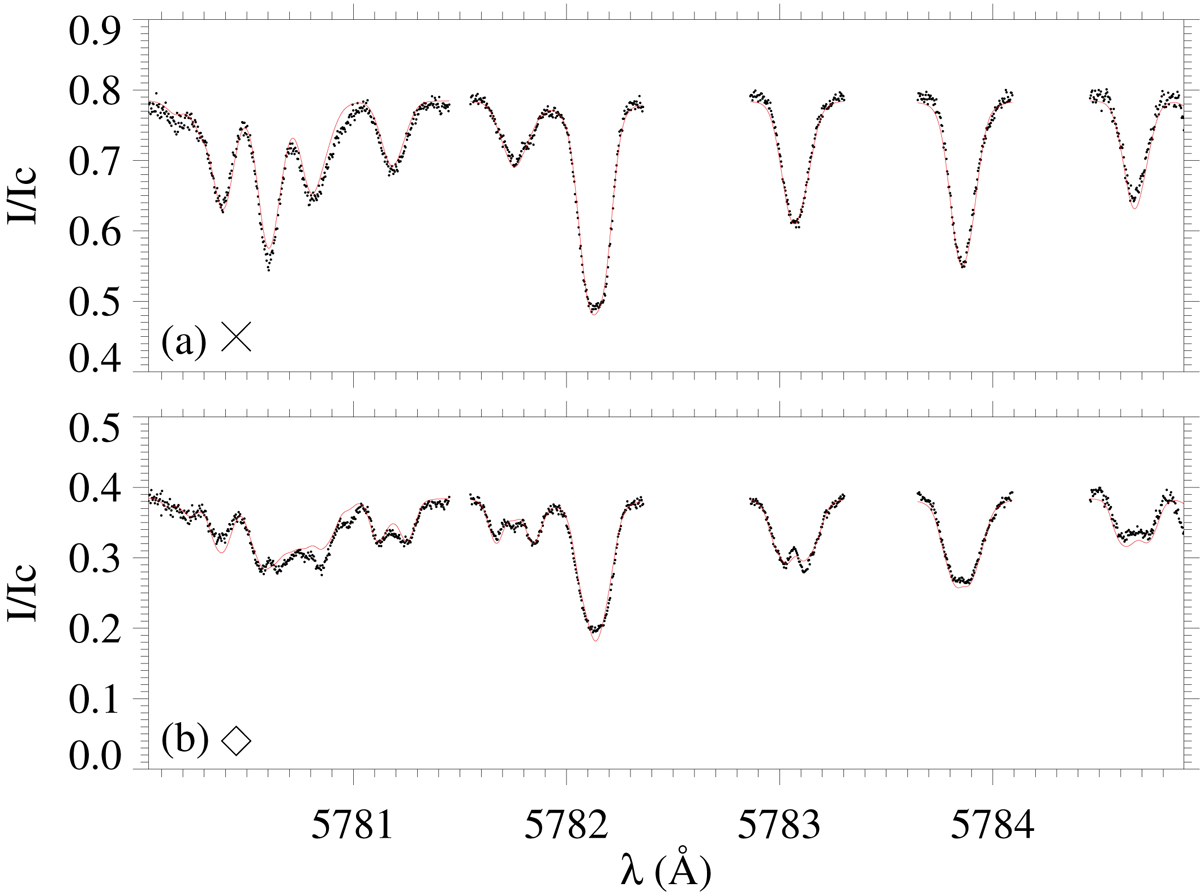
Performance of the inversions for two selected pixels: (a) at the penumbra and (b) in the umbra. The pixels are highlighted with a diamond and cross symbol in Fig. 11. The small black dots represent the observed intensity profile whereas the red solid line shows the best fit of the SIR inversions.
Current usage metrics show cumulative count of Article Views (full-text article views including HTML views, PDF and ePub downloads, according to the available data) and Abstracts Views on Vision4Press platform.
Data correspond to usage on the plateform after 2015. The current usage metrics is available 48-96 hours after online publication and is updated daily on week days.
Initial download of the metrics may take a while.