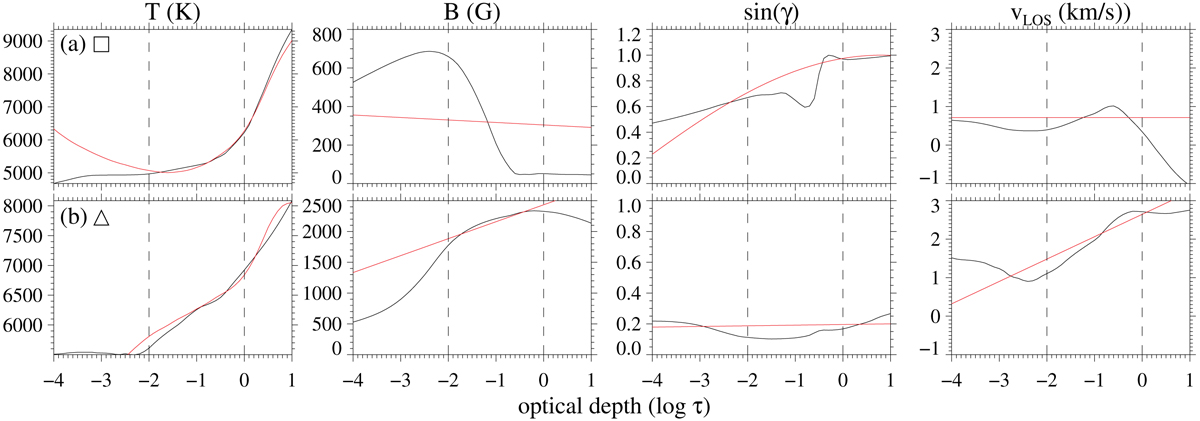
Fig. 8.
Download original image
Atmospheric stratification of two selected pixels extracted from area B from the simulations. Pixel (a) (top row) corresponds to an example of a low magnetic field and is located at (x, y) = (0.53″, 0.13″) in Fig. 5. Pixel (b) (bottom row) is located at (x, y) = (0.86″, 0.53″) and represents a pixel with a strong magnetic field. The solid black (red) line depicts the simulations (inversions). The sensitivity of the spectral lines resides mainly between the optical depths marked by the dashed vertical lines.
Current usage metrics show cumulative count of Article Views (full-text article views including HTML views, PDF and ePub downloads, according to the available data) and Abstracts Views on Vision4Press platform.
Data correspond to usage on the plateform after 2015. The current usage metrics is available 48-96 hours after online publication and is updated daily on week days.
Initial download of the metrics may take a while.