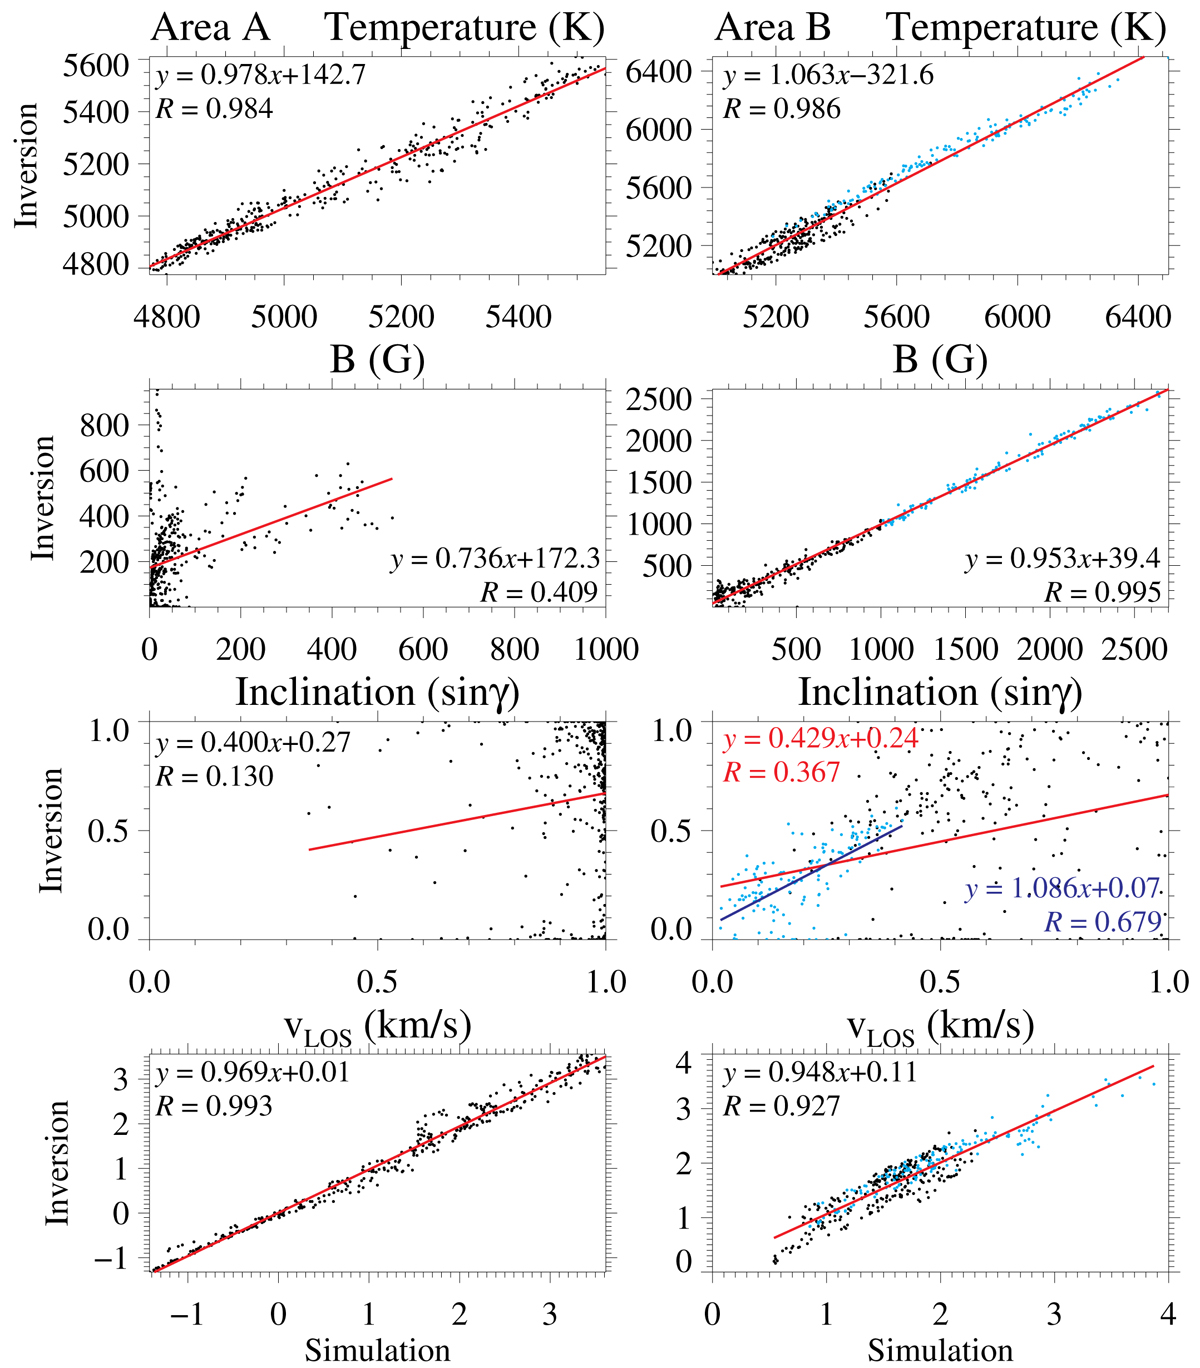
Fig. 6.
Download original image
Scatter plots showing the relationship between physical parameters in the simulations versus in the inversions of areas A (left: strong horizontal fields) and B (right: strong vertical fields) for log τ = −1. The light-blue dots in area B correspond to pixels with B ≥ 1000 G. The correlation coefficient is given by the R value. The equation y represents the red solid line, which is a linear fit to all the points. In the inclination panel of area B the blue solid line fits only the light-blue points and the associated equation y appears in blue.
Current usage metrics show cumulative count of Article Views (full-text article views including HTML views, PDF and ePub downloads, according to the available data) and Abstracts Views on Vision4Press platform.
Data correspond to usage on the plateform after 2015. The current usage metrics is available 48-96 hours after online publication and is updated daily on week days.
Initial download of the metrics may take a while.