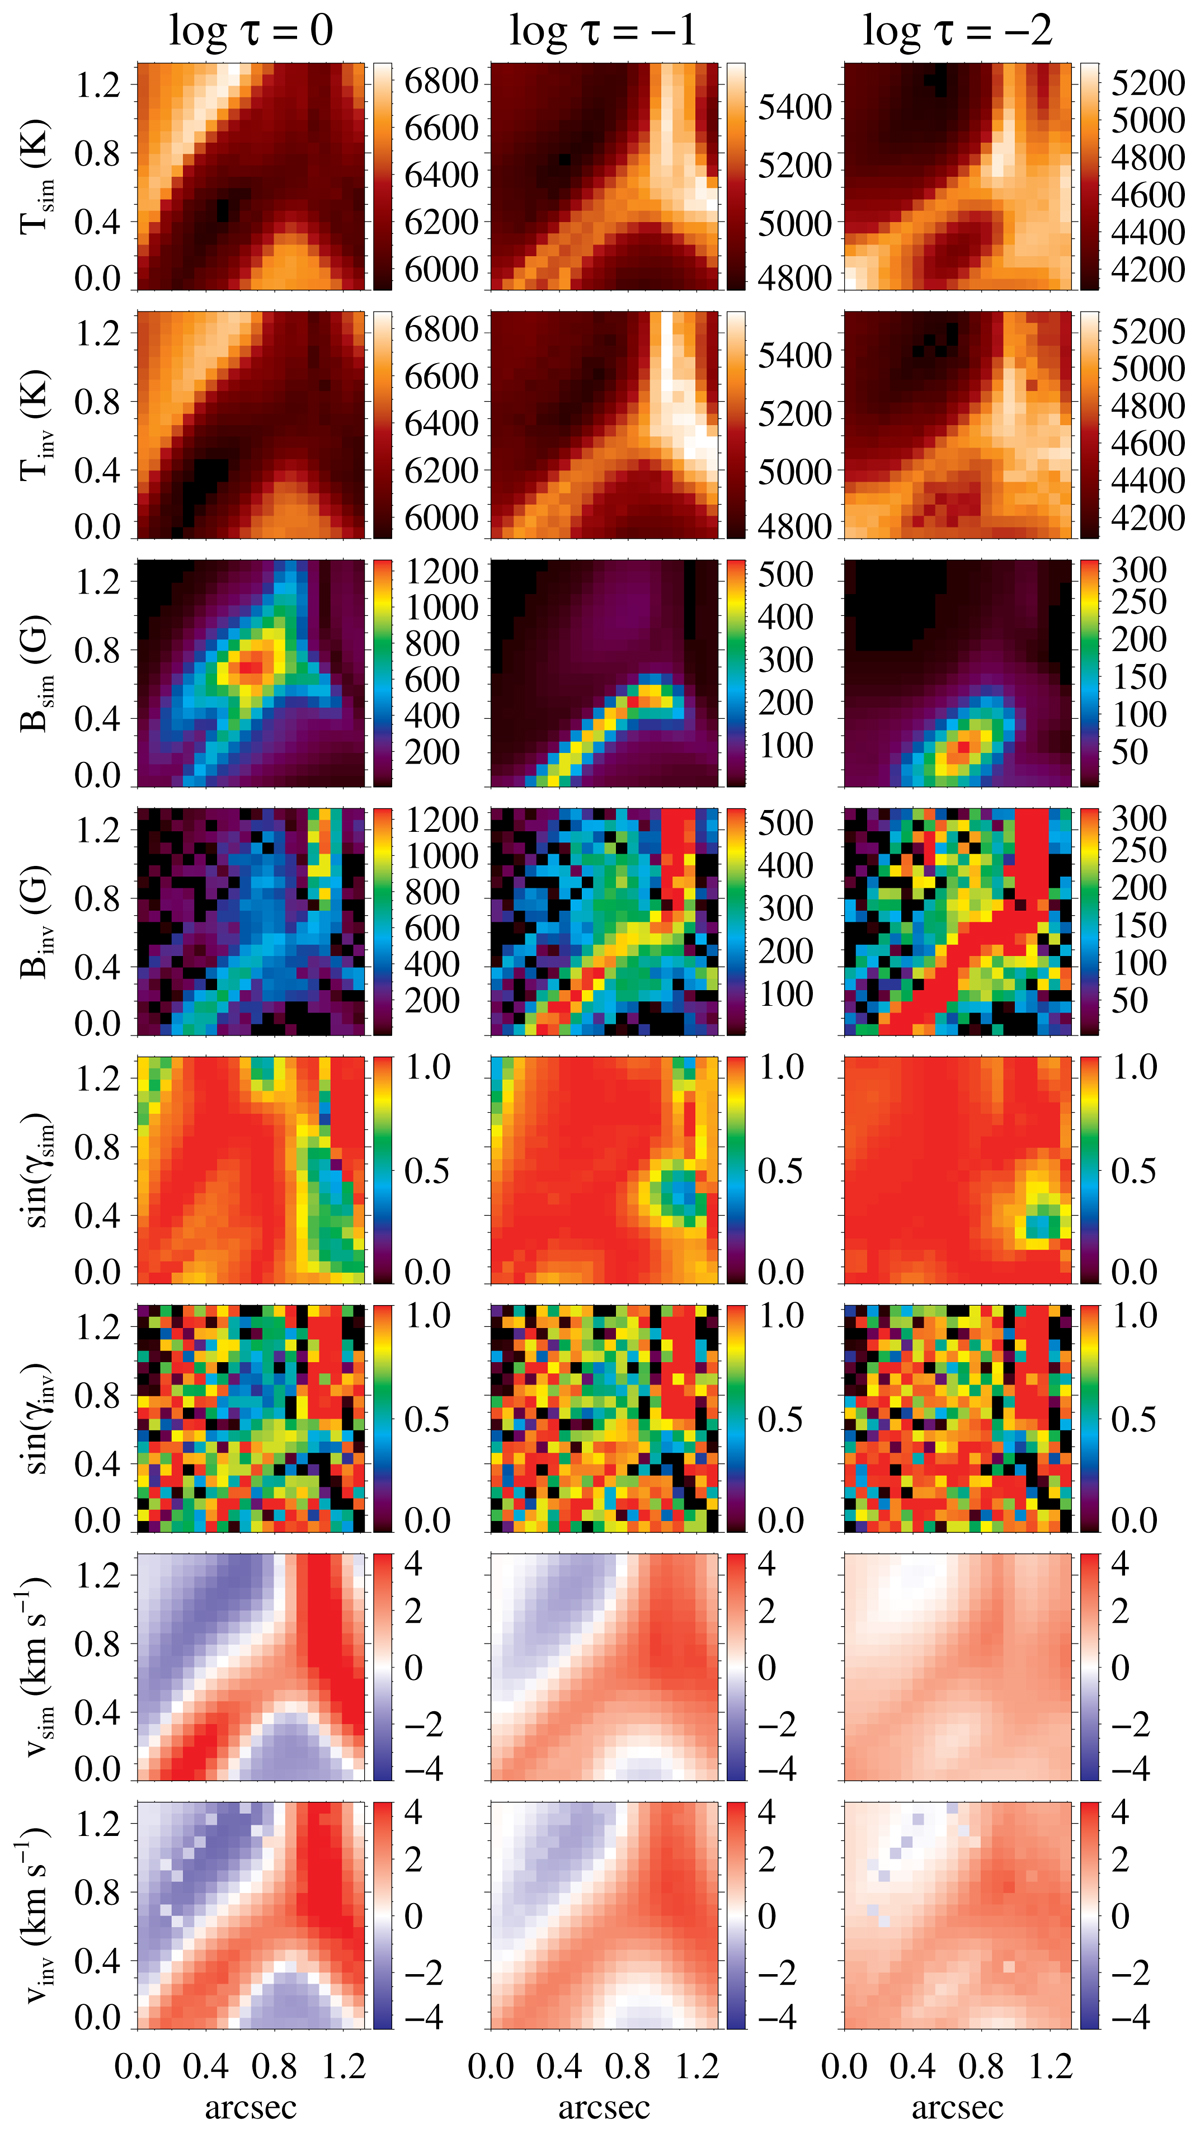
Fig. 4.
Download original image
Comparison of physical parameters between the simulations and the SIR inversions. The cutout area A represents a region of strong horizontal magnetic fields. From top to bottom: Temperature T, magnetic field strength B, sine of the inclination sin(γ), and LOS velocity v. The first row of each physical parameter corresponds to the simulation cube, whereas the second row is the result from the inversions. From left to right: Three different optical depths ascending in height: log τ= 0, −1, and −2. We note that the color scales are variable among the different optical depths in the upper four rows.
Current usage metrics show cumulative count of Article Views (full-text article views including HTML views, PDF and ePub downloads, according to the available data) and Abstracts Views on Vision4Press platform.
Data correspond to usage on the plateform after 2015. The current usage metrics is available 48-96 hours after online publication and is updated daily on week days.
Initial download of the metrics may take a while.