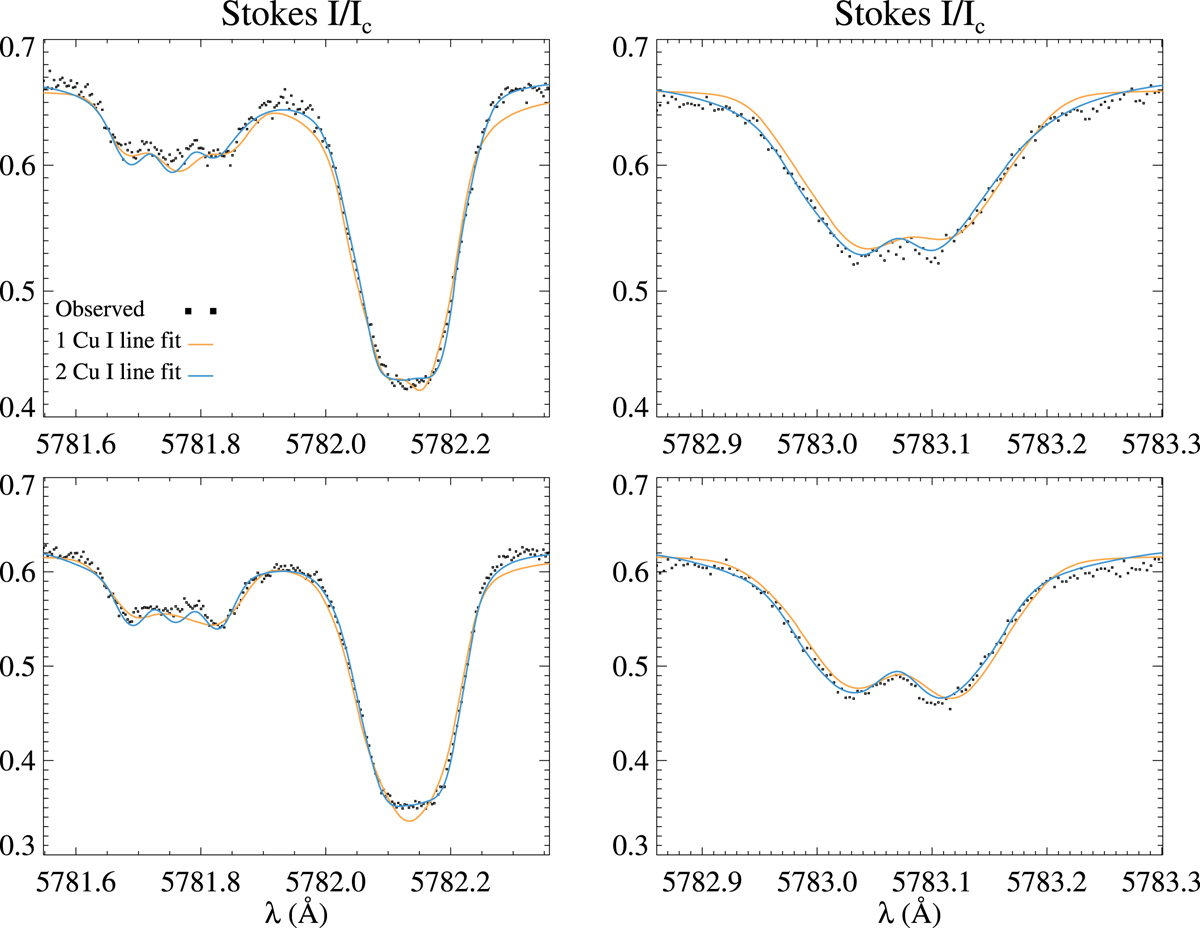
Fig. 3.
Download original image
Inversion results taking into account one or two Cu I lines. The upper and lower rows show the spectra of two different pixels within the sunspot data of the VTT. The dots represent the observations, whereas the orange and blue solid lines show the best fit from the inversion for one or both Cu I lines, respectively. The left panels show the Cr I 5781.75 Å Zeeman-splitted line and next to it on the right the Cu I line(s). The right panel shows the impact of having one or two Cu I lines on the Cr I 5783.06 Å line.
Current usage metrics show cumulative count of Article Views (full-text article views including HTML views, PDF and ePub downloads, according to the available data) and Abstracts Views on Vision4Press platform.
Data correspond to usage on the plateform after 2015. The current usage metrics is available 48-96 hours after online publication and is updated daily on week days.
Initial download of the metrics may take a while.