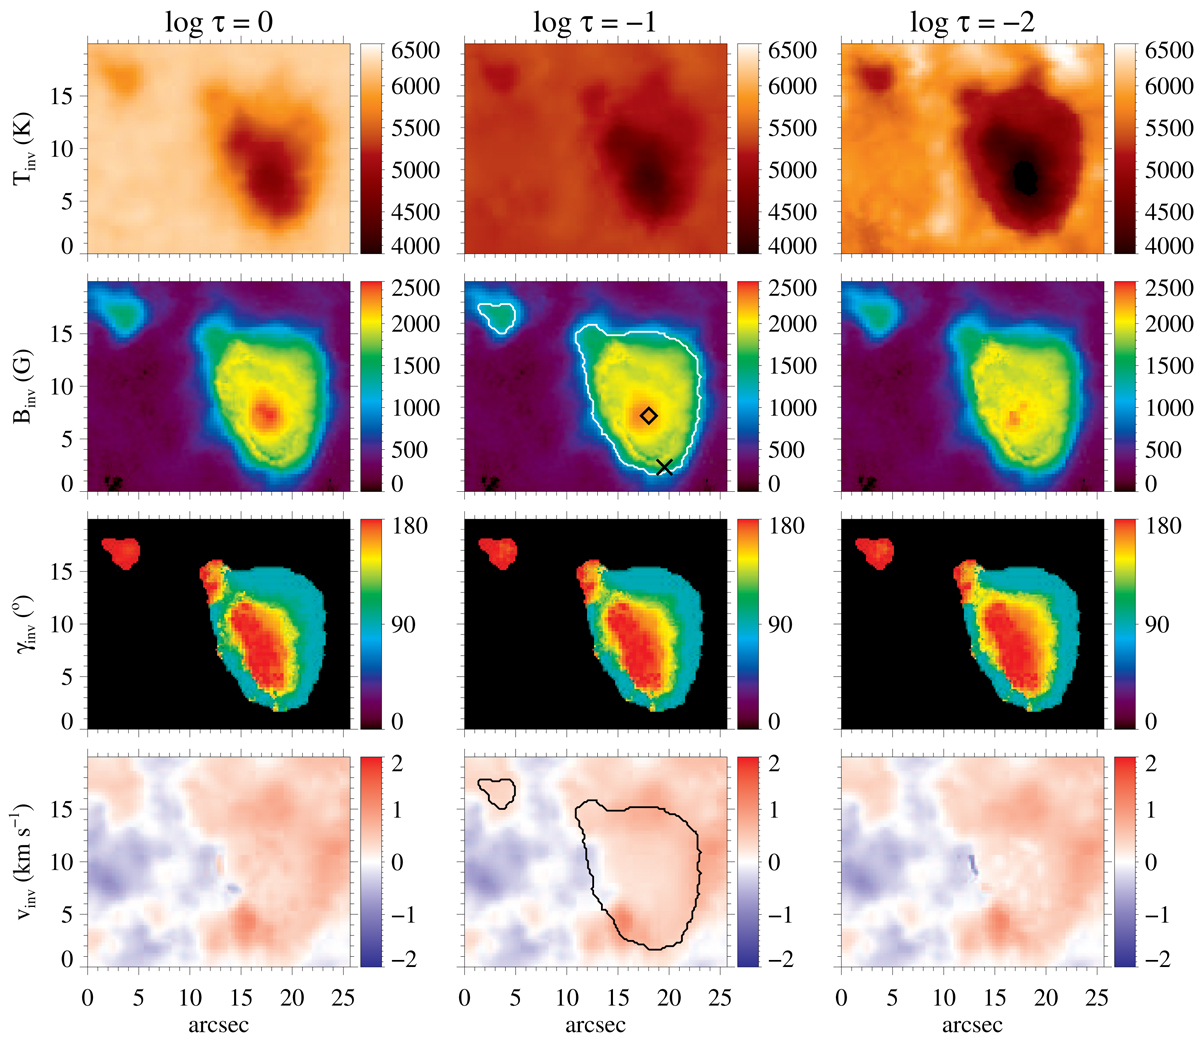
Fig. 11.
Download original image
Results from the multi-line inversions of the VTT observations. Top to bottom: temperature Tinv, magnetic field strength Binv, magnetic field inclination γinv, and LOS velocity vinv. Left to right: different optical depths log τ = 0, −1, and −2. The white or black contours correspond to a magnetic field of 1000 G and were used to highlight the sunspot and pore. These contours serve as a mask for the inclination maps, showing only the inferred values for the sunspot and the pore, where the results are more reliable. The cross and diamond symbols show the location of the pixels plotted in Figs. 9 and 10.
Current usage metrics show cumulative count of Article Views (full-text article views including HTML views, PDF and ePub downloads, according to the available data) and Abstracts Views on Vision4Press platform.
Data correspond to usage on the plateform after 2015. The current usage metrics is available 48-96 hours after online publication and is updated daily on week days.
Initial download of the metrics may take a while.