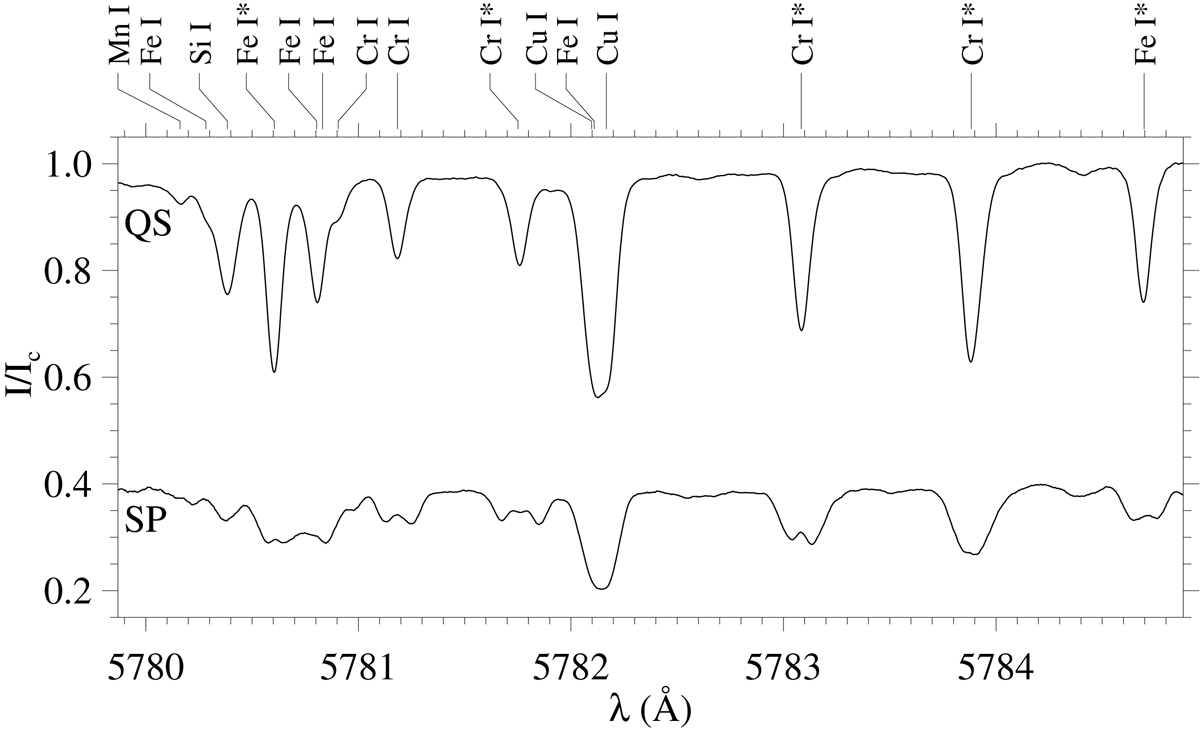
Fig. 1.
Download original image
Observed spectra with the VTT. The upper spectrum corresponds to an average quiet-Sun profile (QS), whereas the lower spectrum represents one profile within the sunspot (SP), roughly at the center of the umbra. The SP spectrum is an average over five spectral pixels using a Lee-filter, available on the Interactive Data Language (IDL) with the routine leefilt.pro, an algorithm used to reduce the noise. The splitting of the spectral lines is clearly visible in the strong sunspot field. Lines marked with a star (*) are used as the main lines in the inversions. All other lines are considered as blends in the Stokes Inversion based on Response functions (SIR) code. The atomic parameters for each line are listed in Table 1.
Current usage metrics show cumulative count of Article Views (full-text article views including HTML views, PDF and ePub downloads, according to the available data) and Abstracts Views on Vision4Press platform.
Data correspond to usage on the plateform after 2015. The current usage metrics is available 48-96 hours after online publication and is updated daily on week days.
Initial download of the metrics may take a while.