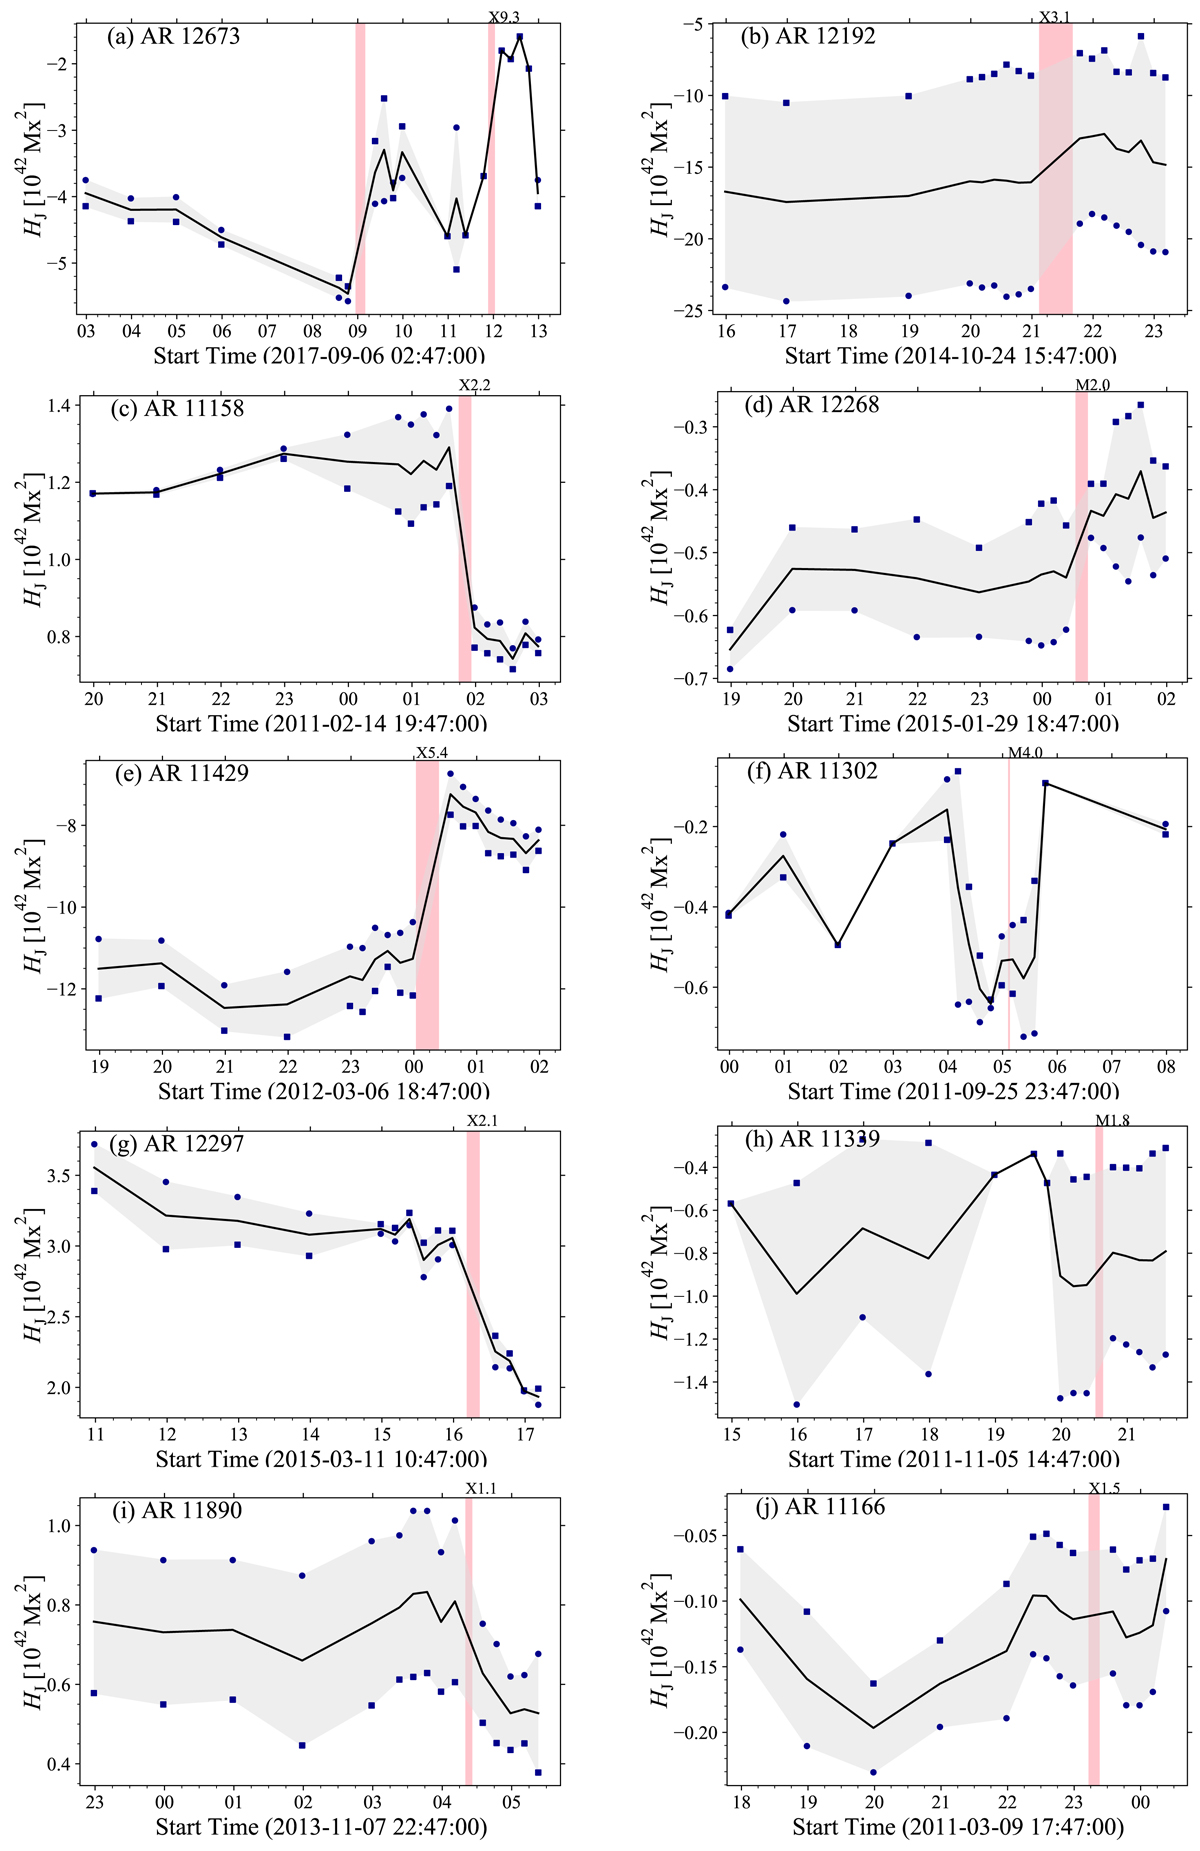
Fig. 3.
Download original image
Time evolution of the current-carrying helicity HJ for the ten ARs under study. Quantities for ARs productive of large eruptive and confined flares are shown in the left and right columns, respectively. Squares (bullets) indicate the solutions based on enhanced (standard) divergence freeness. The gray shaded areas mark the spread of HJ, and the black curve indicate the average values. The vertical bar marks the impulsive flare phase.
Current usage metrics show cumulative count of Article Views (full-text article views including HTML views, PDF and ePub downloads, according to the available data) and Abstracts Views on Vision4Press platform.
Data correspond to usage on the plateform after 2015. The current usage metrics is available 48-96 hours after online publication and is updated daily on week days.
Initial download of the metrics may take a while.