Fig. 9.
Download original image
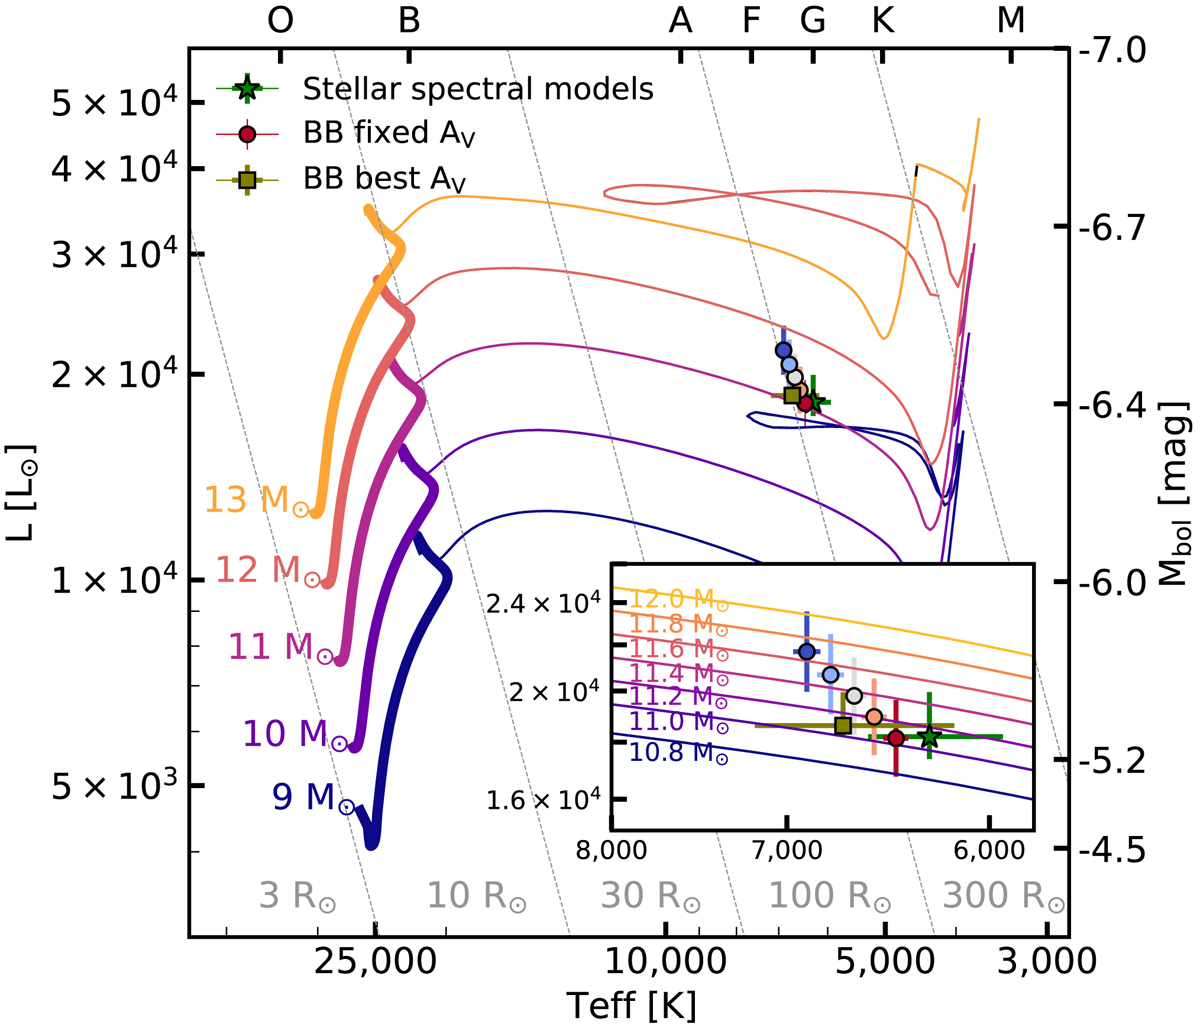
Location of the AT 2018bwo progenitor in the HR diagram. MESA single stellar evolution tracks are shown for stars between 9 and 13 M⊙. The main sequence is marked with a thicker line. Different markers represent progenitor parameters using different models (see Table 4). The insert shows a zoomed in region around the progenitor location, along with a finer grid of models.
Current usage metrics show cumulative count of Article Views (full-text article views including HTML views, PDF and ePub downloads, according to the available data) and Abstracts Views on Vision4Press platform.
Data correspond to usage on the plateform after 2015. The current usage metrics is available 48-96 hours after online publication and is updated daily on week days.
Initial download of the metrics may take a while.