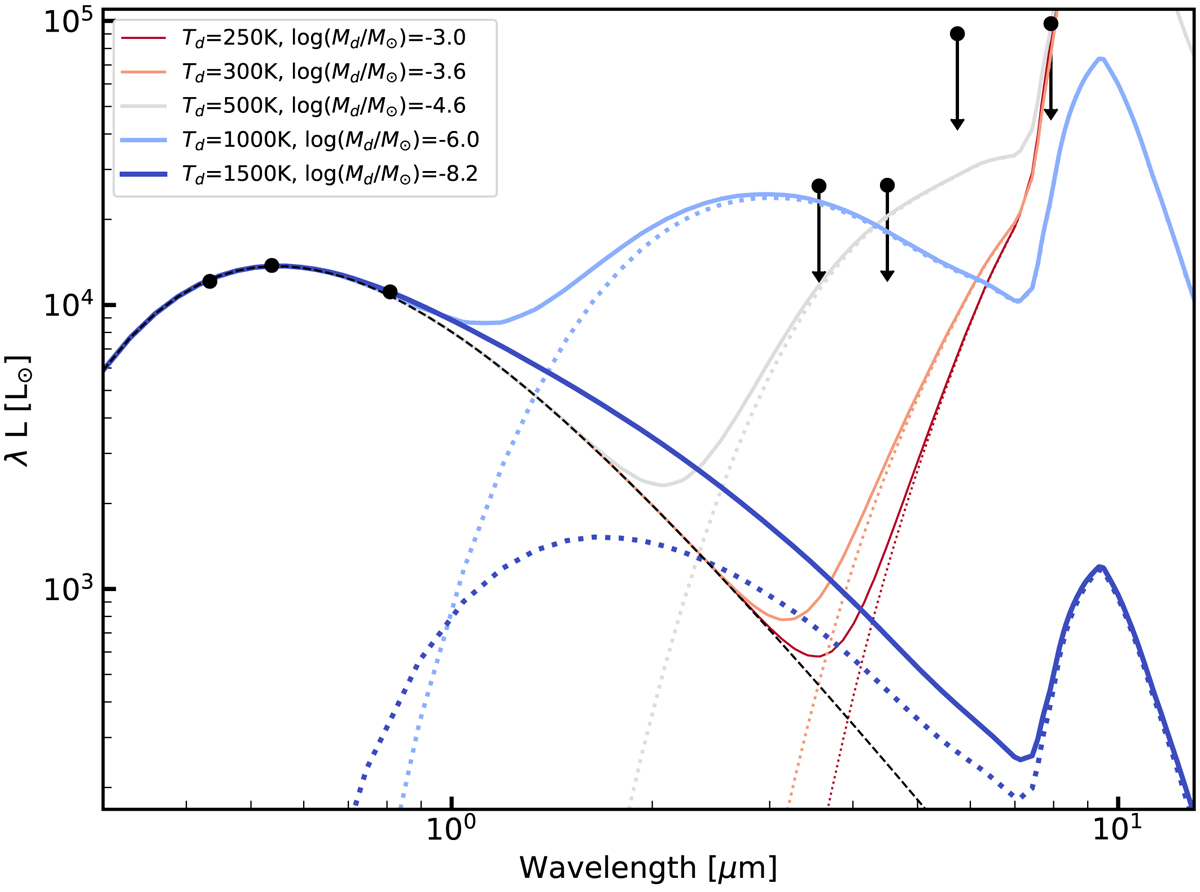
Fig. 8.
Download original image
HST progenitor photometry and nondetection limits from Spitzer. The dust is composed of a = 0.1 μm silicate grains radiating at a uniform temperature. The black line shows the contribution of the optical SED. The dotted lines show the contribution of the dust emission at different temperatures and the solid coloured lines represent the combined optical and infrared SED.
Current usage metrics show cumulative count of Article Views (full-text article views including HTML views, PDF and ePub downloads, according to the available data) and Abstracts Views on Vision4Press platform.
Data correspond to usage on the plateform after 2015. The current usage metrics is available 48-96 hours after online publication and is updated daily on week days.
Initial download of the metrics may take a while.