Fig. 4.
Download original image
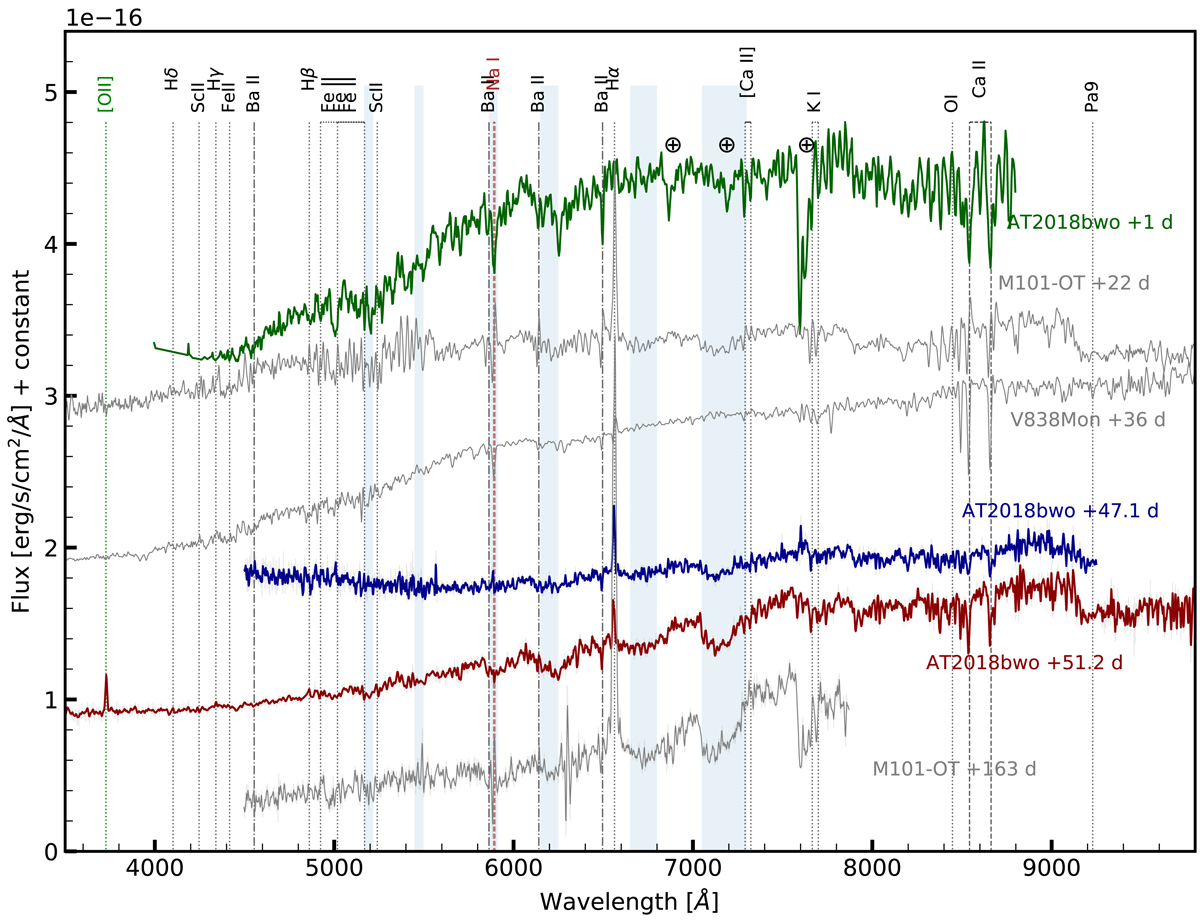
Spectral evolution of AT 2018bwo (coloured lines) as compared to V838 Mon (Smith et al. 2016) and M101 OT2015-1 (Blagorodnova et al. 2017) (gray lines). The main emission and absorption lines have been identified in the plot. The regions with strong molecular TiO absorption have been shown with light blue rectangles. Regions with strong telluric absorption are marked with the ⊕ sign. In these spectra, the [Ca II] is detected in absorption, in contrast with the usual emission profile identified in other transients such as LBVs or ILRTs.
Current usage metrics show cumulative count of Article Views (full-text article views including HTML views, PDF and ePub downloads, according to the available data) and Abstracts Views on Vision4Press platform.
Data correspond to usage on the plateform after 2015. The current usage metrics is available 48-96 hours after online publication and is updated daily on week days.
Initial download of the metrics may take a while.