Fig. 16.
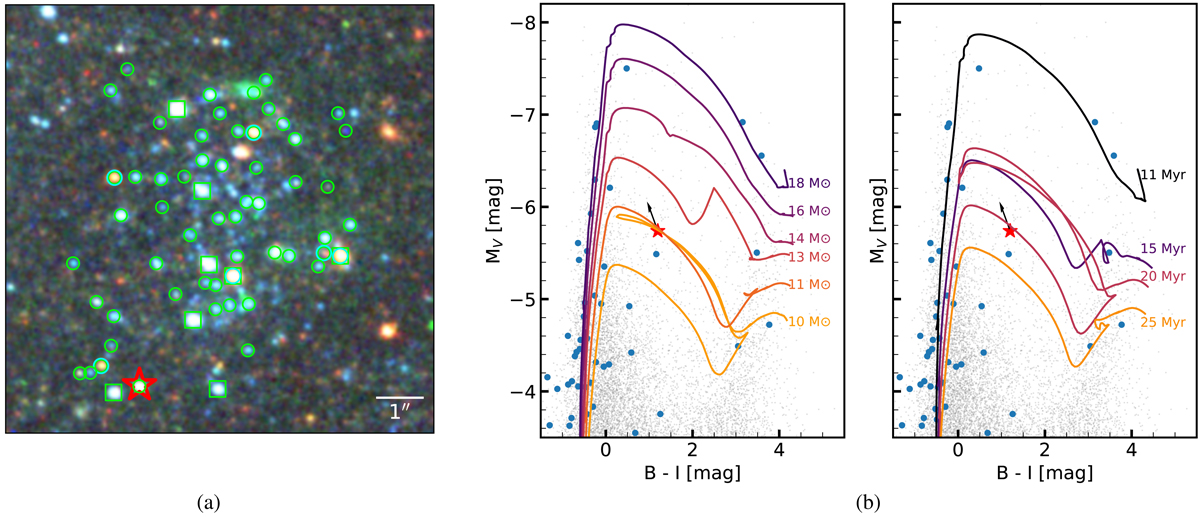
Download original image
Left: cluster environment associated with the progenitor of AT 2018bwo. Orientation north is up and east is left. The stars included in the analysis (cluster components) are marked with lime circles. The ones brighter than the progenitor in the HST V-band are marked with a square. The progenitor is marked with a red star. Middle: colour-magnitude diagram in B–I (F435W – F814W) bands for HST simulated magnitudes from MESA as compared to the progenitor magnitude. The initial mass for each model is labeled in the plot. Right: same diagram, but showing the isochrones for different stellar ages. In both plots, the location of the AT 2018bwo progenitor is marked with a red star. The black arrow indicates the location of the progenitor when corrected for AV = 0.2. The cluster components are shown in blue, and the rest of field stars in the same HST pointing are shown in faint gray.
Current usage metrics show cumulative count of Article Views (full-text article views including HTML views, PDF and ePub downloads, according to the available data) and Abstracts Views on Vision4Press platform.
Data correspond to usage on the plateform after 2015. The current usage metrics is available 48-96 hours after online publication and is updated daily on week days.
Initial download of the metrics may take a while.