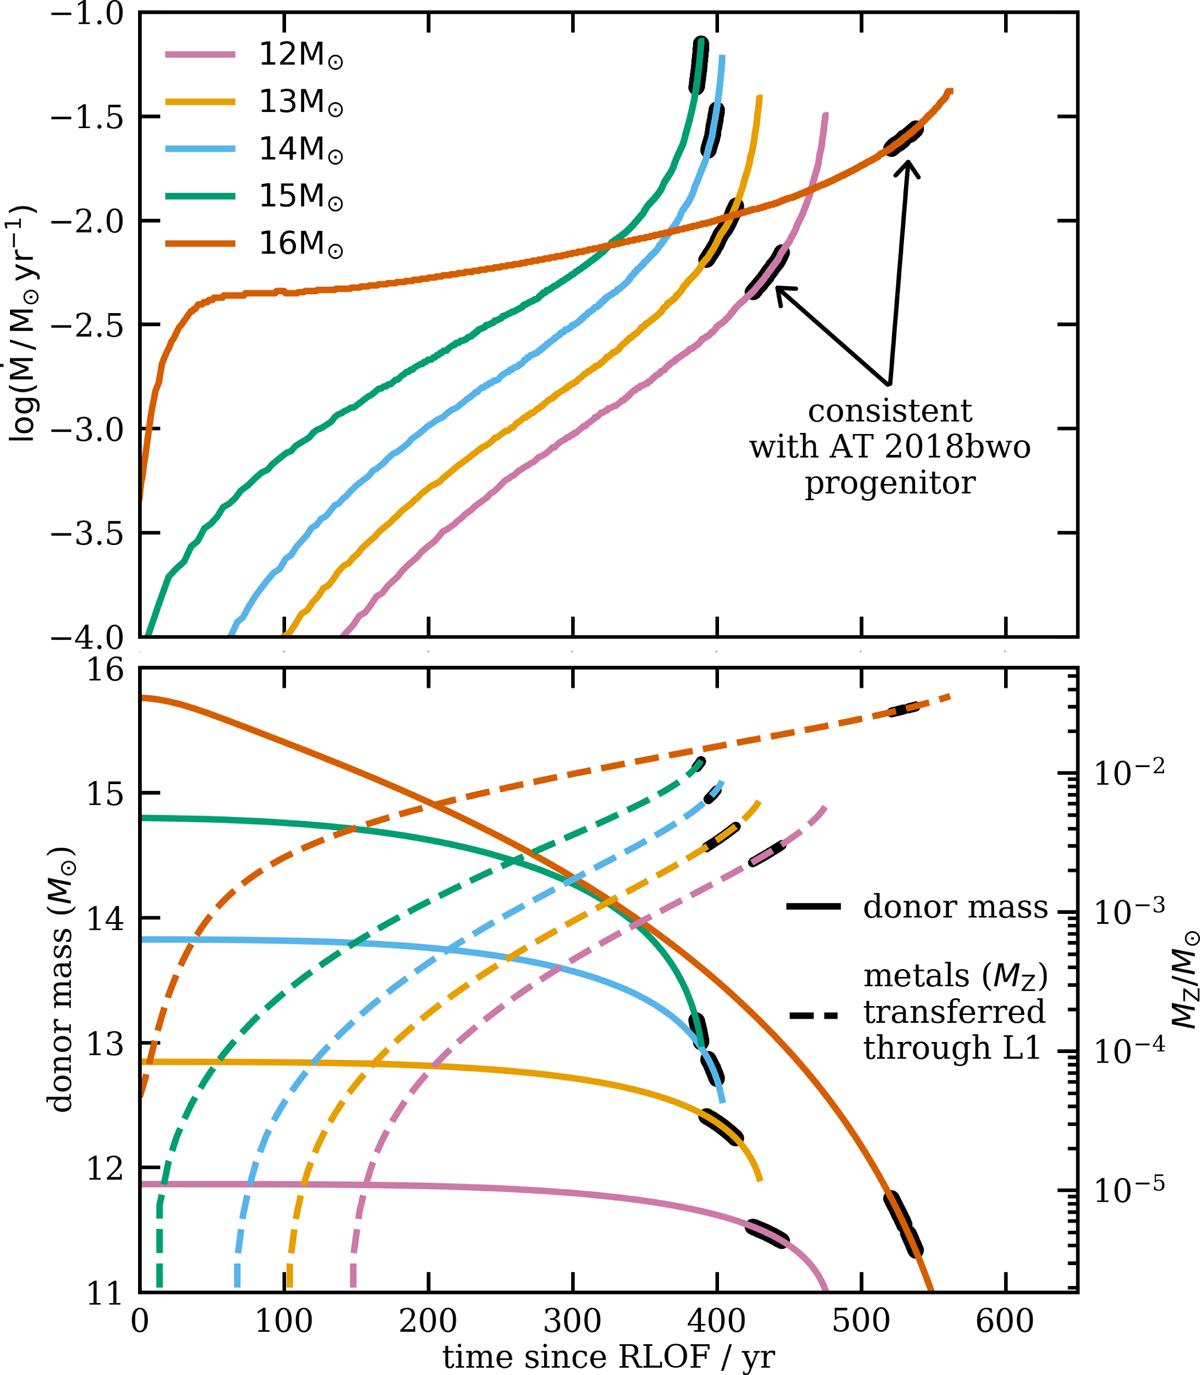
Fig. 14.
Download original image
Time evolution of the mass transfer rate (upper panel) and the donor mass as well as the cumulative mass of metals MZ transferred through L1 since RLOF (lower panel) in five exemplary binary models in which the position of the donor in the HR diagram is consistent with the AT 2018bwo progenitor (see Fig. 10). The mass transfer rate at which the donor is consistent with the AT 2018bwo progenitor (marked with bold in the figure) depends on the initial mass of the donor. The evolution of Ṁ is distinctively different in the 16 M⊙ case because of a shallow outer convective zone in the envelope of the 16 M⊙ donor at RLOF.
Current usage metrics show cumulative count of Article Views (full-text article views including HTML views, PDF and ePub downloads, according to the available data) and Abstracts Views on Vision4Press platform.
Data correspond to usage on the plateform after 2015. The current usage metrics is available 48-96 hours after online publication and is updated daily on week days.
Initial download of the metrics may take a while.