Fig. 13.
Download original image
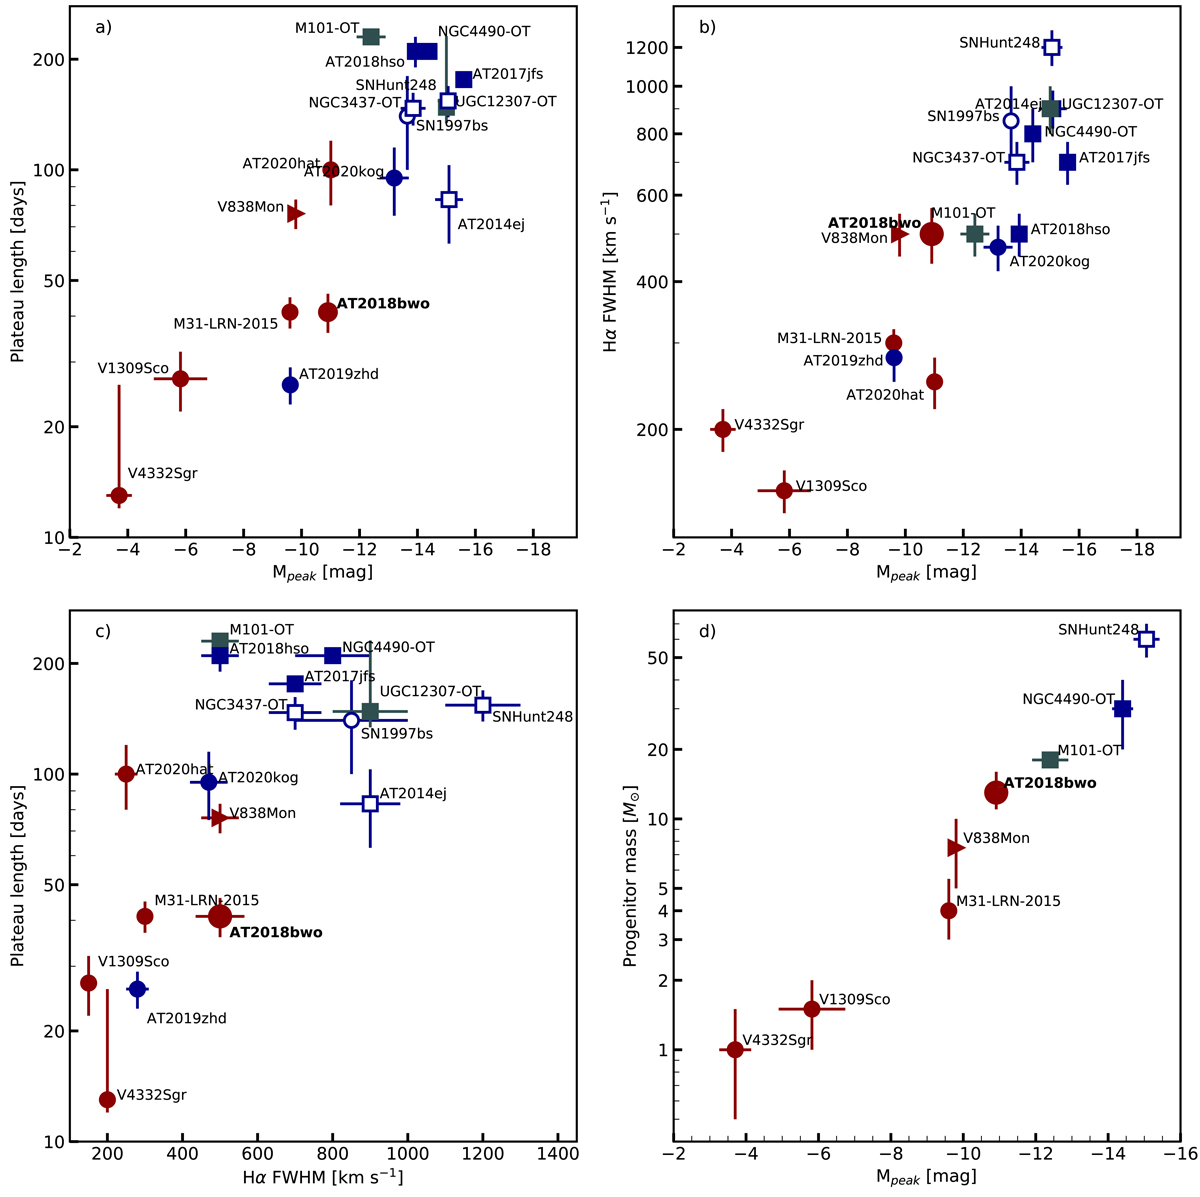
Top left: peak absolute magnitude in V, R or r-band versus the length of the plateau in that band. Top right: peak absolute magnitude vs. the FWHM of the Hα line, which is a proxy for the outflow expansion velocity. Bottom left: plateau length vs. Hα FWHM. Bottom right: estimated mass of the progenitor star vs. transient peak magnitude in V, R or r-bands. Filled circles represent LRNe that developed molecular absorption bands at later times. Open circles indicate additional LRNe candidates whose nature is still debated. Circles represent LRNe with one initial peak followed by a plateau. Squares are LRNe having a slower secondary red peak. Triangles show LRNe with 3 maxima. Red markers represents transients that already showed red continuum during the first peak. Blue markers correspond to LRNe that showed a hotter continuum and Balmer emission lines at early times. Gray markers are used for transients without early times spectroscopy. The name of some transients has been shortened for clarity.
Current usage metrics show cumulative count of Article Views (full-text article views including HTML views, PDF and ePub downloads, according to the available data) and Abstracts Views on Vision4Press platform.
Data correspond to usage on the plateform after 2015. The current usage metrics is available 48-96 hours after online publication and is updated daily on week days.
Initial download of the metrics may take a while.