Fig. 10.
Download original image
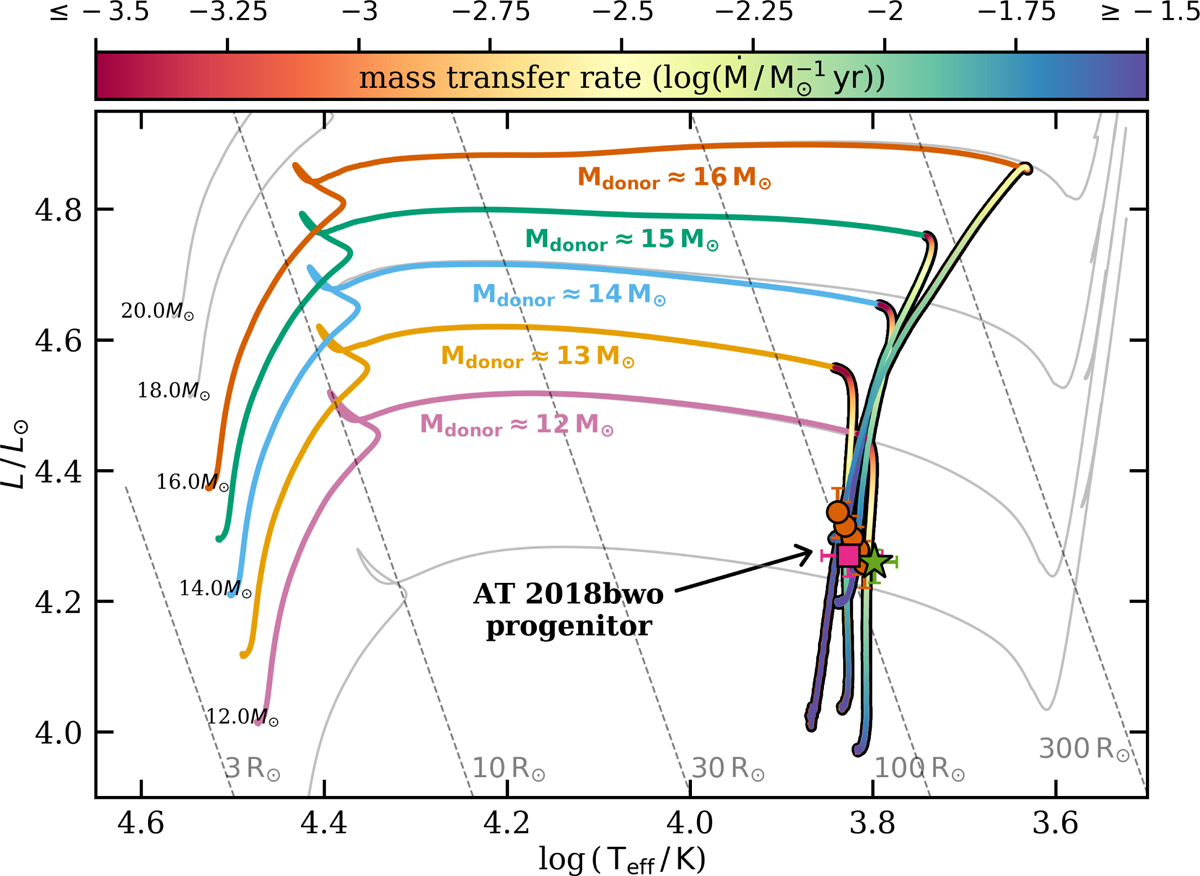
Evolution of donor stars of different masses in the HR diagram, derived from binary stellar evolution tracks computed with MESA. Nonrotating single stellar tracks from Klencki et al. (2020) are plotted with thin gray lines. The binary models assume a mass ratio of q = Mdon/Macc = 5.0 (3.5 in the case of the Mdon = 16 M⊙ model), and the initial orbital periods were chosen such that the mass-loosing donors are consistent with the location of the AT 2018bwo progenitor in the diagram, albeit for different mass transfer rates.
Current usage metrics show cumulative count of Article Views (full-text article views including HTML views, PDF and ePub downloads, according to the available data) and Abstracts Views on Vision4Press platform.
Data correspond to usage on the plateform after 2015. The current usage metrics is available 48-96 hours after online publication and is updated daily on week days.
Initial download of the metrics may take a while.