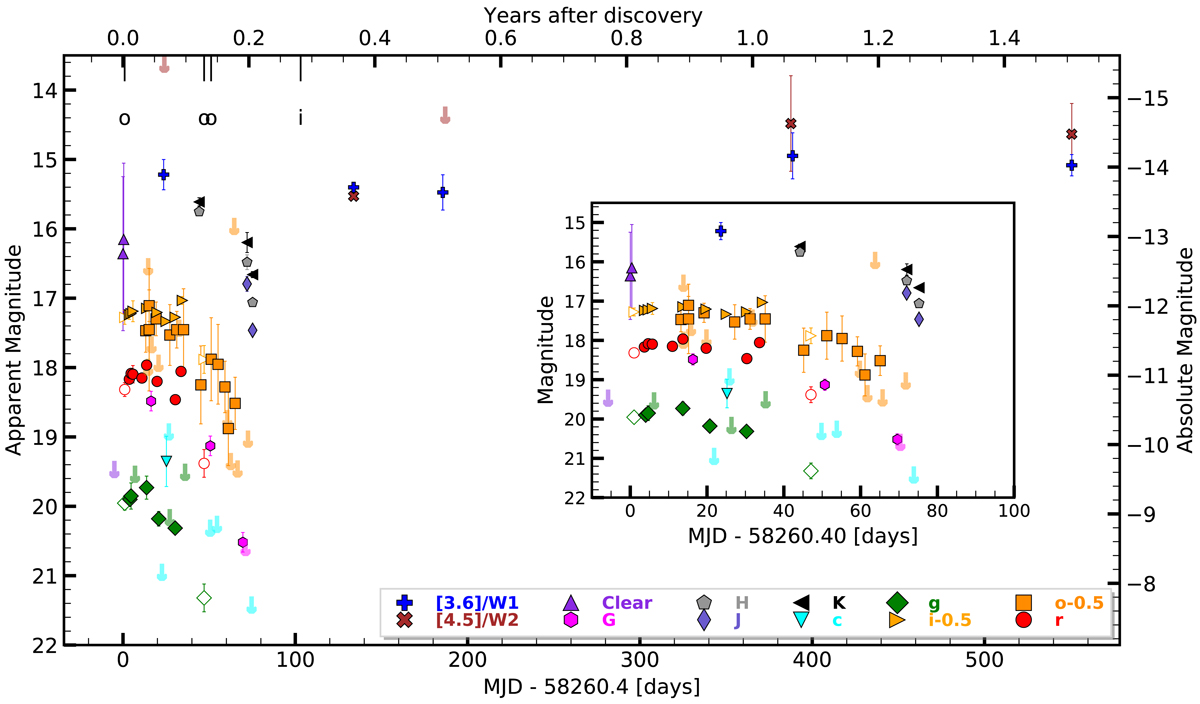
Fig. 1.
Download original image
Light curve of AT 2018bwo. Optical magnitudes are in AB system and IR magnitudes are in Vega. The phase is shown as days from discovery. The open markers correspond to synthetic photometry from flux calibrated spectra. The ATLAS data are shown with a 1 day binning. The measurements are colour-coded and offset according to the legend. Arrows represent upper limits. The vertical lines at the top show the dates when optical (o) and infra-red (i) spectroscopy was obtained. The insert shows a zoom in of the light curve.
Current usage metrics show cumulative count of Article Views (full-text article views including HTML views, PDF and ePub downloads, according to the available data) and Abstracts Views on Vision4Press platform.
Data correspond to usage on the plateform after 2015. The current usage metrics is available 48-96 hours after online publication and is updated daily on week days.
Initial download of the metrics may take a while.