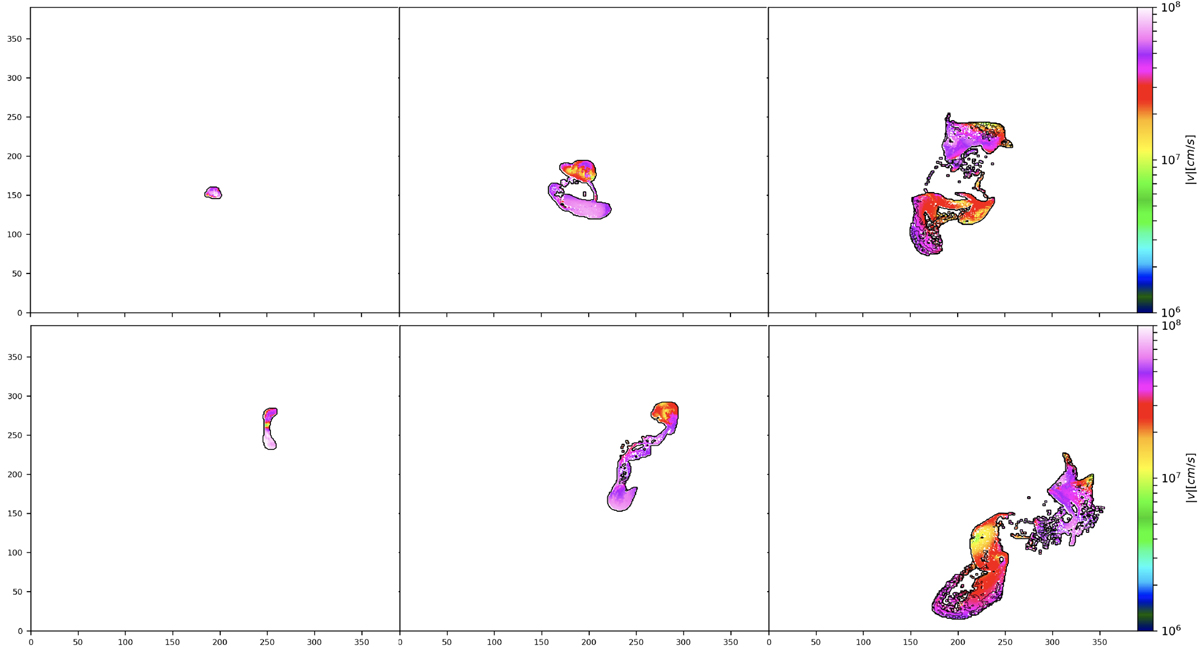
Fig. 9.
Download original image
Velocity magnitude for tracers released by jets in Run2 at three different epochs (z = 0.46, z = 0.37 and z = 0.16 from left to right, respectively), and averaged along the two different lines of sight. Top row: evolution of the lobes seen along the line of sight parallel to the jet axis, while second row: evolution seen along a perpendicular line of sight (the same as in Fig. 4). The axes are in units of cells of the simulation (δx = 8.86 kpc co-moving).
Current usage metrics show cumulative count of Article Views (full-text article views including HTML views, PDF and ePub downloads, according to the available data) and Abstracts Views on Vision4Press platform.
Data correspond to usage on the plateform after 2015. The current usage metrics is available 48-96 hours after online publication and is updated daily on week days.
Initial download of the metrics may take a while.