Fig. 8.
Download original image
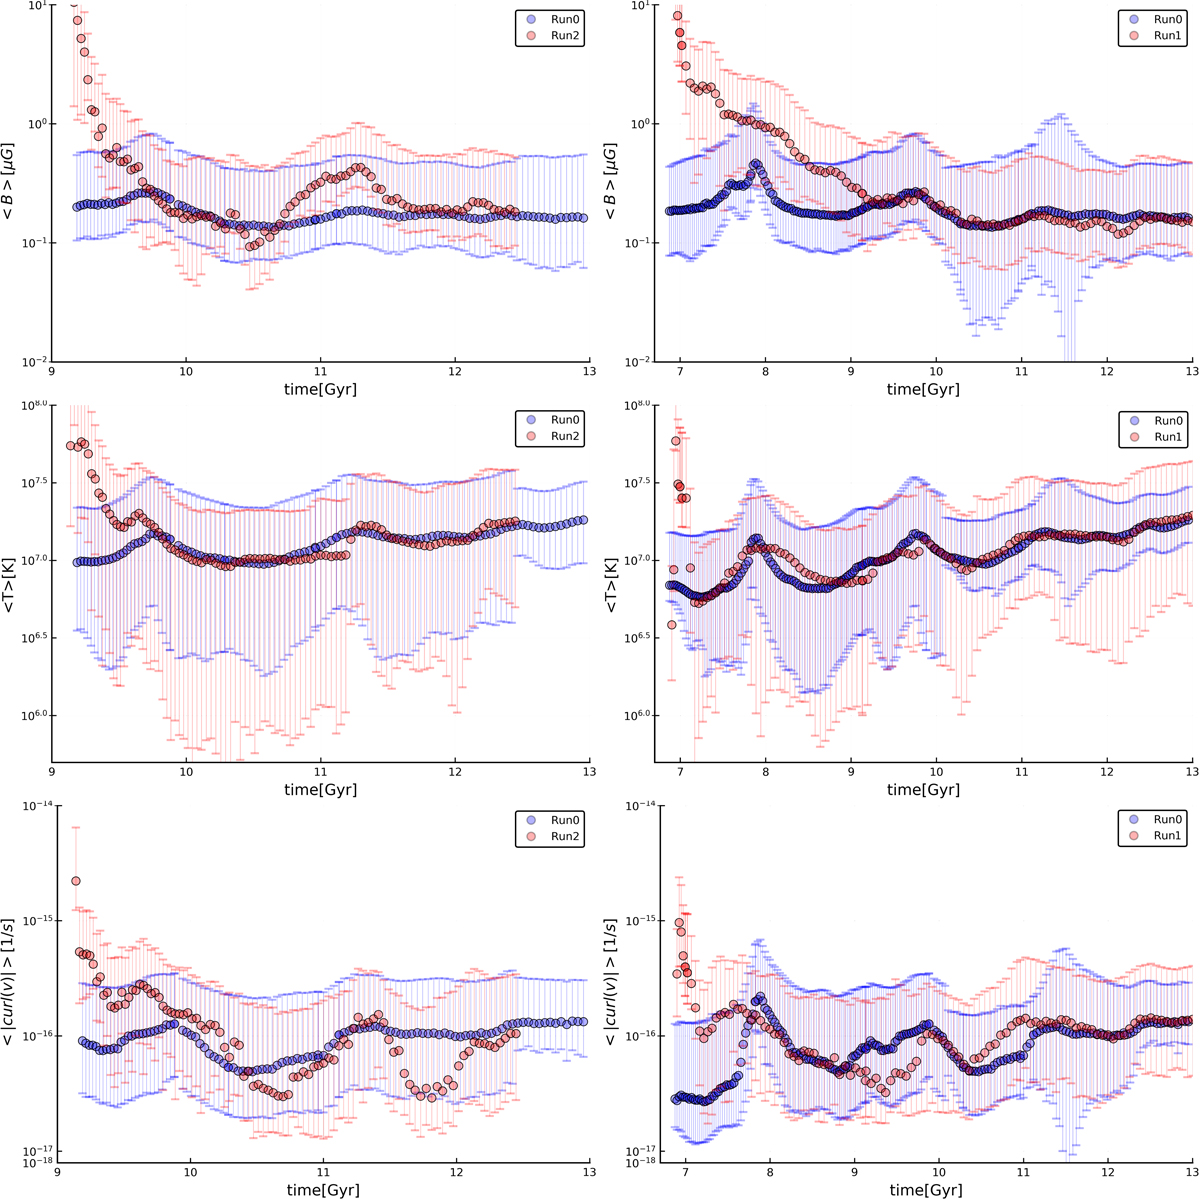
Evolution of the median magnetic field strength, temperature, and absolute value of vorticity for tracers in our runs (the error bars show the 16−84th percentiles of the distributions at each redshift) comparing Run2 versus Run0 (left panels, injection at z = 0.5) and Run1 versus Run0 (right, injection at z = 1). The properties of tracers are measured at each redshift for particles at the radial distance from the cluster centre ≤0.5 Mpc.
Current usage metrics show cumulative count of Article Views (full-text article views including HTML views, PDF and ePub downloads, according to the available data) and Abstracts Views on Vision4Press platform.
Data correspond to usage on the plateform after 2015. The current usage metrics is available 48-96 hours after online publication and is updated daily on week days.
Initial download of the metrics may take a while.