Free Access
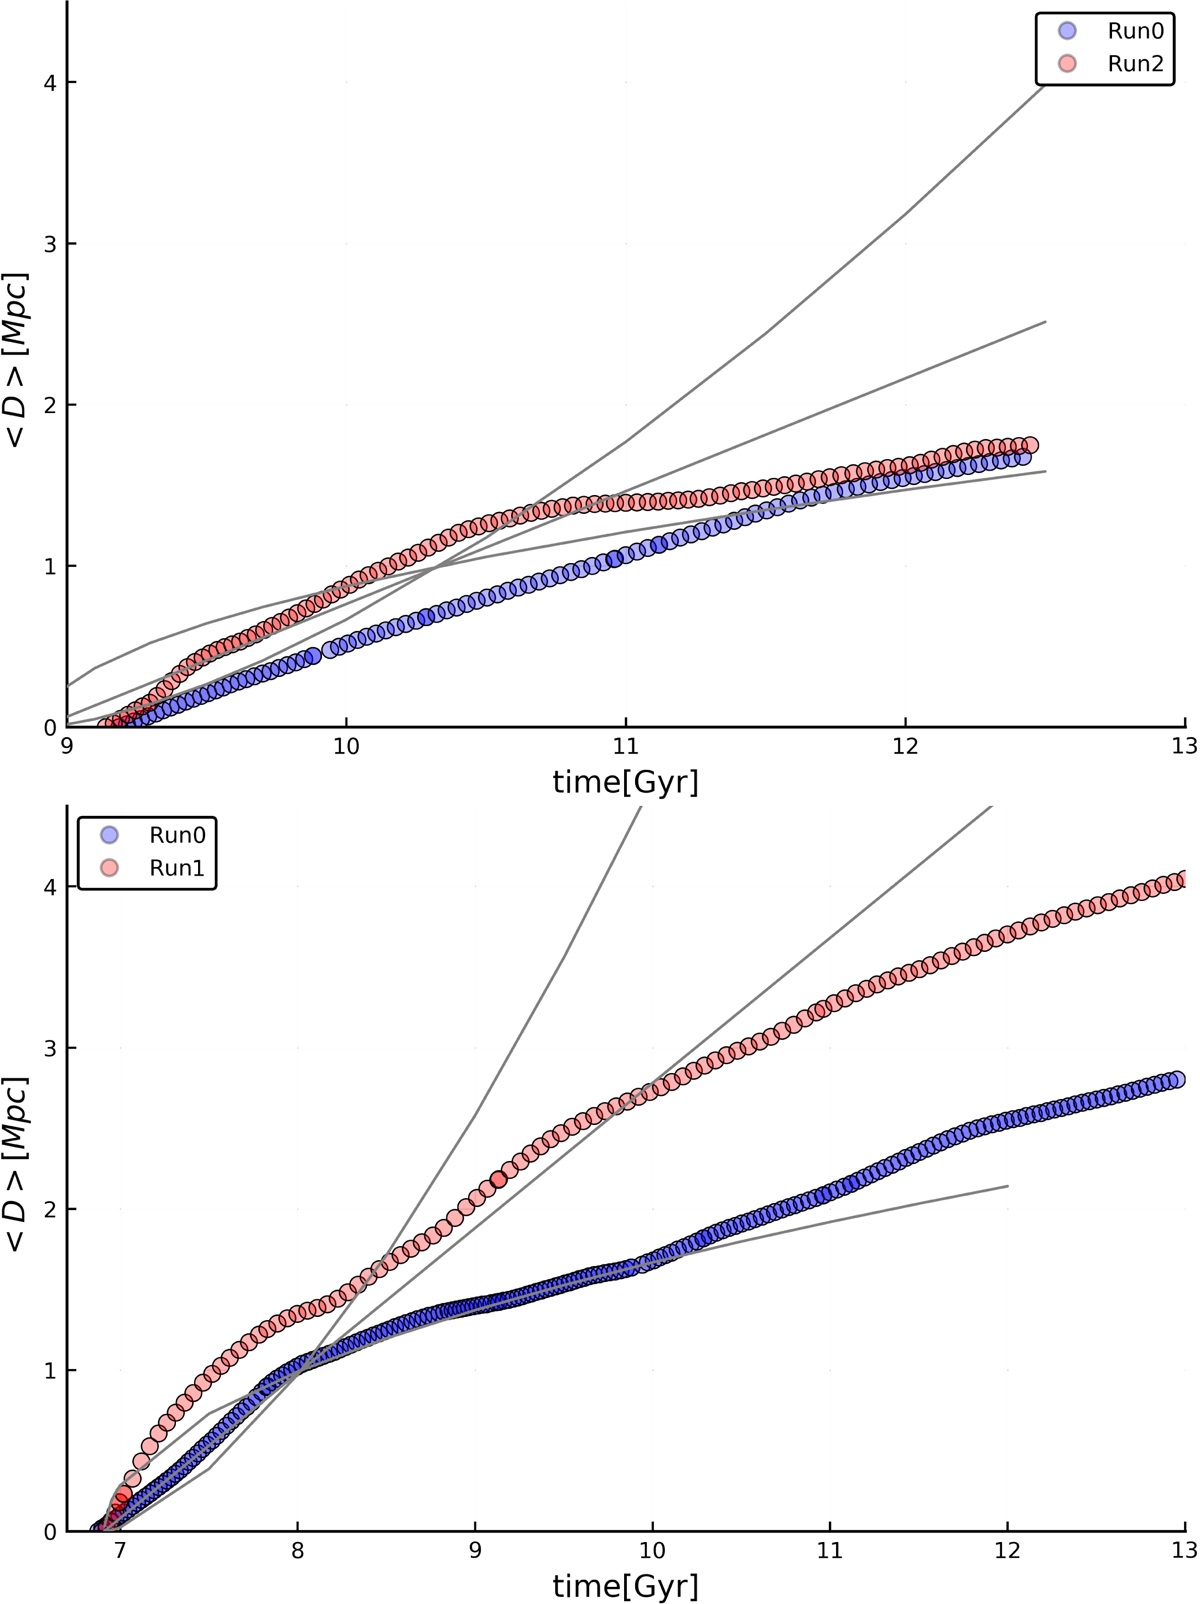
Fig. 7.
Download original image
Evolution of the median distance (in co-moving Mpc) covered by tracers since their initial injection in our runs as a function of time for Run2 versus Run0 (top, injection at z = 0.5) and for Run1 versus Run0 (bottom, injection at z = 1). The additional grey lines give the D ∝ t3/2, ∝t and ∝t1/2 trends to guide the eye.
Current usage metrics show cumulative count of Article Views (full-text article views including HTML views, PDF and ePub downloads, according to the available data) and Abstracts Views on Vision4Press platform.
Data correspond to usage on the plateform after 2015. The current usage metrics is available 48-96 hours after online publication and is updated daily on week days.
Initial download of the metrics may take a while.