Free Access
Fig. 18.
Download original image
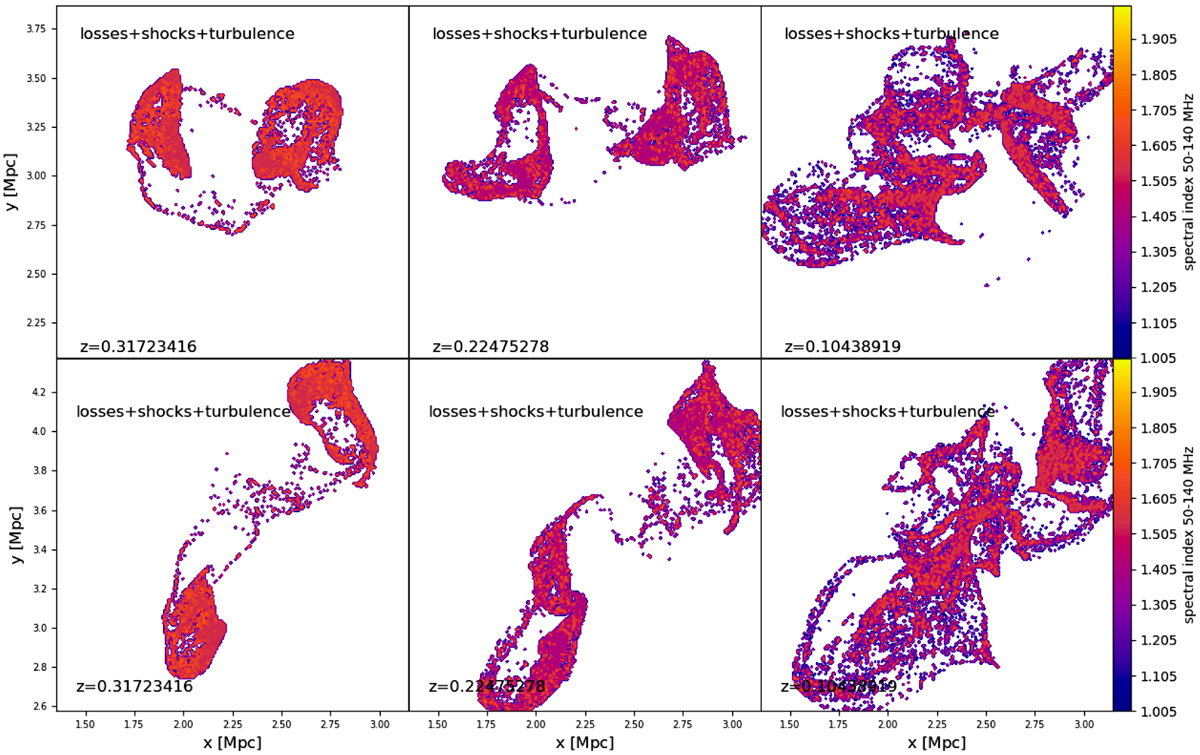
Radio spectral index maps for the 50−140 MHz range, for three epochs and two lines of sight, for the Run2 simulation. Only regions detectable with LOFAR-HBA (as in Fig. 16) are shown.
Current usage metrics show cumulative count of Article Views (full-text article views including HTML views, PDF and ePub downloads, according to the available data) and Abstracts Views on Vision4Press platform.
Data correspond to usage on the plateform after 2015. The current usage metrics is available 48-96 hours after online publication and is updated daily on week days.
Initial download of the metrics may take a while.