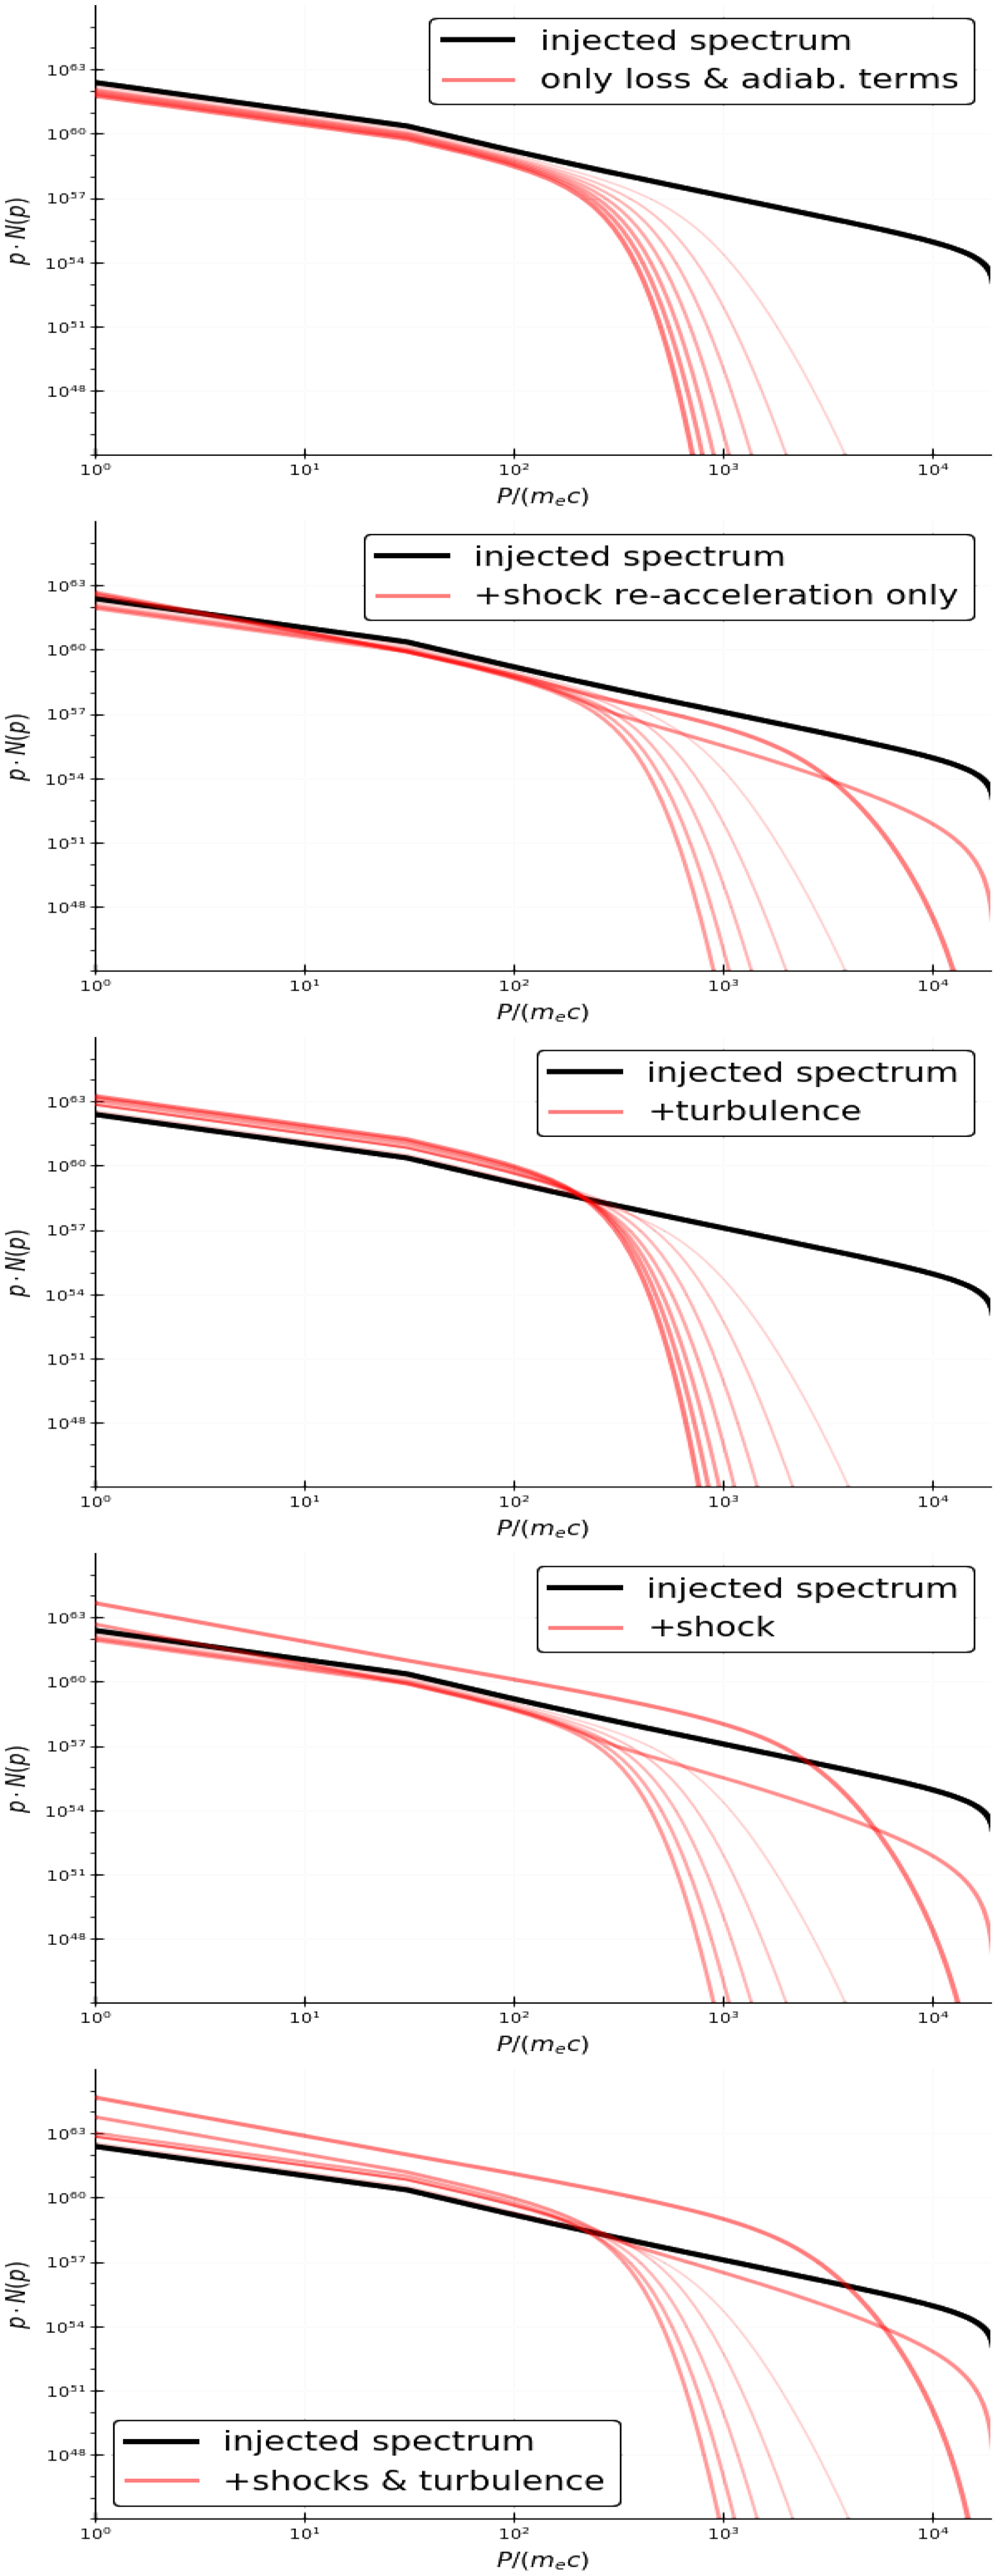
Fig. 12.
Download original image
Evolution (from z = 0.5 to z = 0.1) of spectral energy distribution of a sample of 100 electron tracers initially located in the most magnetised regions of jets in the Run2 model, for several combinations of re-acceleration scenarios (see labels). The initial particle spectrum is given by the solid black line and the evolution of spectra (equally spaced every ≈0.5 Gyr) goes from the most to the least transparent lines.
Current usage metrics show cumulative count of Article Views (full-text article views including HTML views, PDF and ePub downloads, according to the available data) and Abstracts Views on Vision4Press platform.
Data correspond to usage on the plateform after 2015. The current usage metrics is available 48-96 hours after online publication and is updated daily on week days.
Initial download of the metrics may take a while.