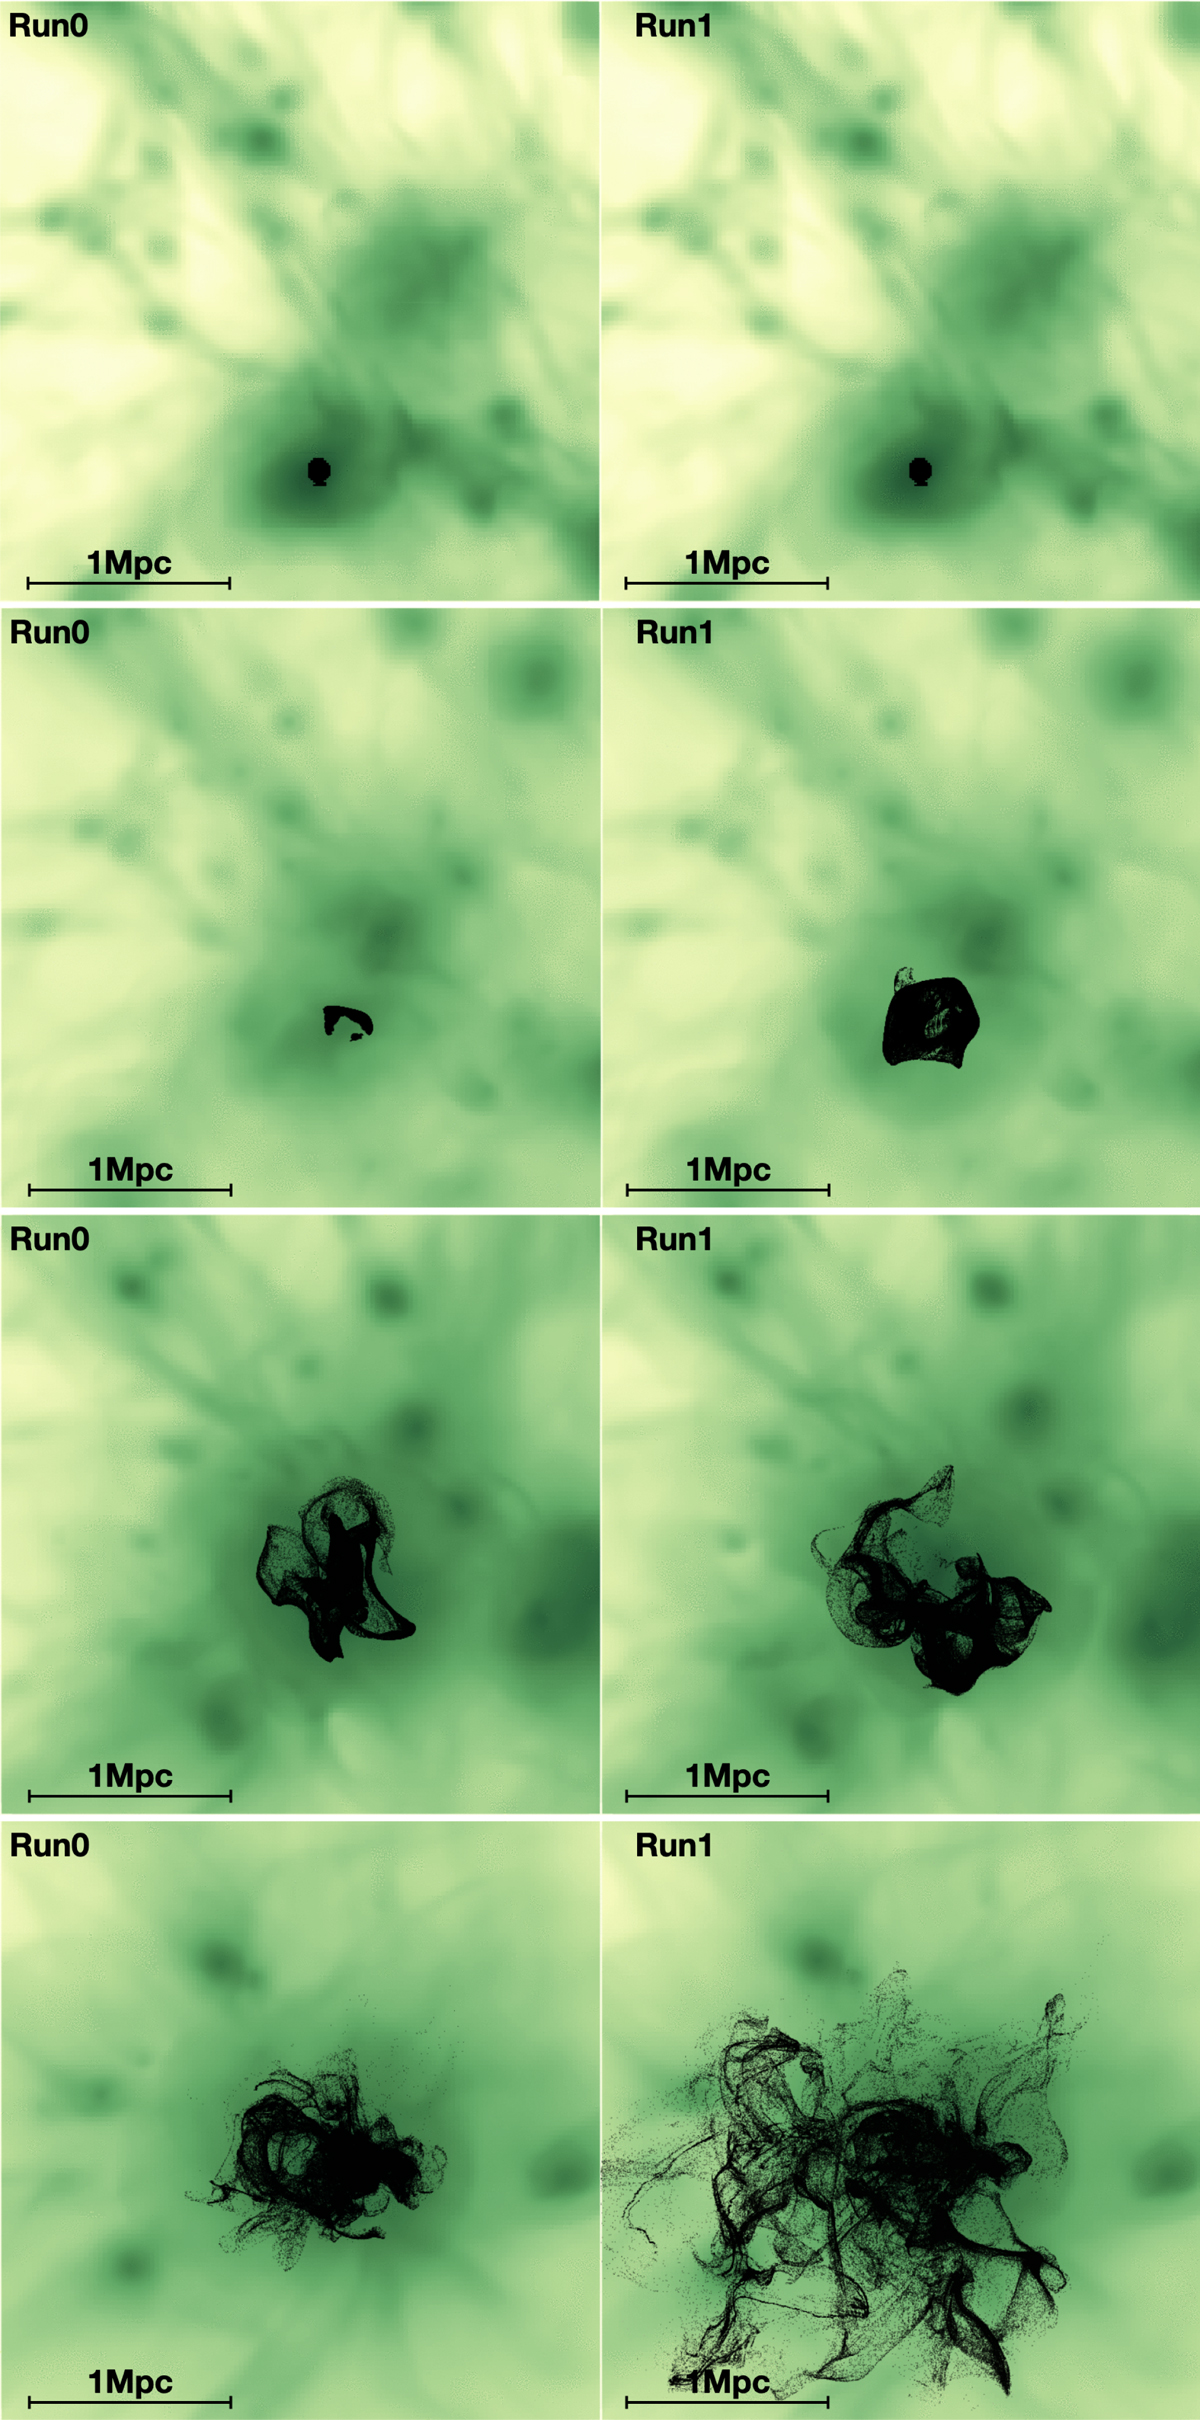
Fig. 1.
Download original image
Maps of all tracers evolved in our run Run0 (left) and Run1 (right) at z = 1, z = 0.8, z = 0.5, and z = 0.1. The colours represent the projected gas density (with a log10 stretching). The line of sight is parallel to the jet axis, to give a sense of the lateral expansion of tracers relative to the jet (which points towards the observer in this case).
Current usage metrics show cumulative count of Article Views (full-text article views including HTML views, PDF and ePub downloads, according to the available data) and Abstracts Views on Vision4Press platform.
Data correspond to usage on the plateform after 2015. The current usage metrics is available 48-96 hours after online publication and is updated daily on week days.
Initial download of the metrics may take a while.