Fig. 8

Download original image
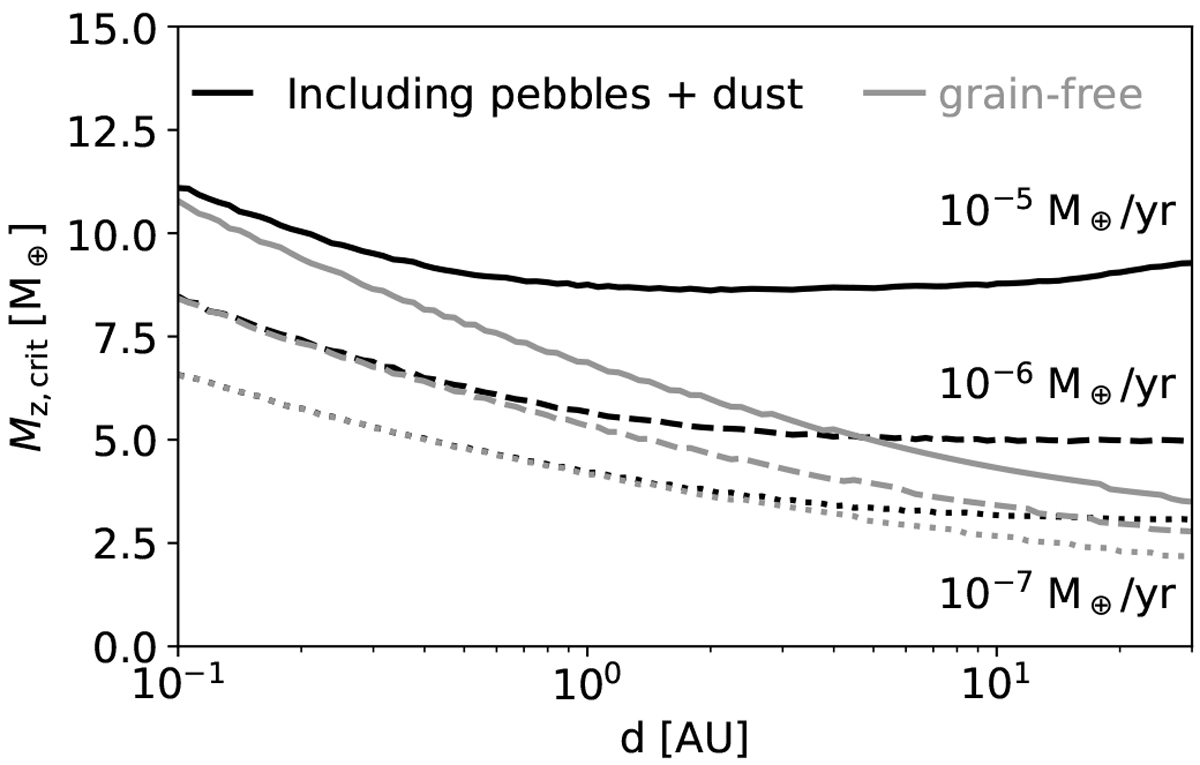
Trends in the critical metal mass as a function of distance. The different lines correspond to a variation in solids accretion rates: 10−7 M⊕ yr−1 (dotted), 10−6 M⊕ yr−1 (dashed), 10−5 M⊕ yr−1 (solid), with proportional gas accretion Ṁxy∕Ṁpeb = 5 and the remaining parameters set by Table 1. Planets with grain-free envelopes (gray lines) exhibit a downward trend with orbital separation because the molecular opacity scales positively with temperature. The opacity generated by pebbles and dust (black lines) increases the critical mass significantly in the outer disk, especially at higher accretion rates.
Current usage metrics show cumulative count of Article Views (full-text article views including HTML views, PDF and ePub downloads, according to the available data) and Abstracts Views on Vision4Press platform.
Data correspond to usage on the plateform after 2015. The current usage metrics is available 48-96 hours after online publication and is updated daily on week days.
Initial download of the metrics may take a while.


