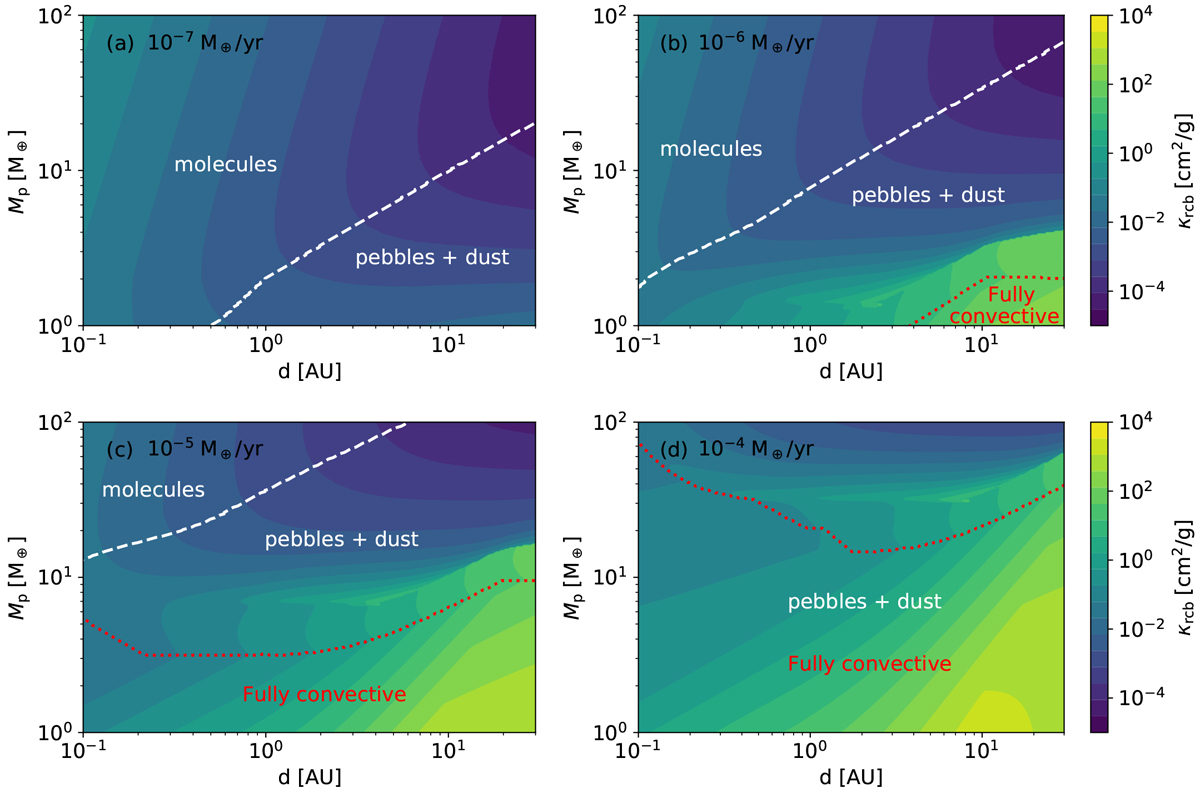
Fig. 7
Download original image
Compilation grid of 106 runs, where the colors indicate the opacity at the RCB as a function of the planet’s semimajor axis and mass at four different pebble accretion rates. The white dashed lines divide the zones where different opacity contributions dominate. The red dotted lines mark the parameter space where the entire envelope is convective due to high opacities in the velocity-limited regime.
Current usage metrics show cumulative count of Article Views (full-text article views including HTML views, PDF and ePub downloads, according to the available data) and Abstracts Views on Vision4Press platform.
Data correspond to usage on the plateform after 2015. The current usage metrics is available 48-96 hours after online publication and is updated daily on week days.
Initial download of the metrics may take a while.