Fig. 4
Download original image
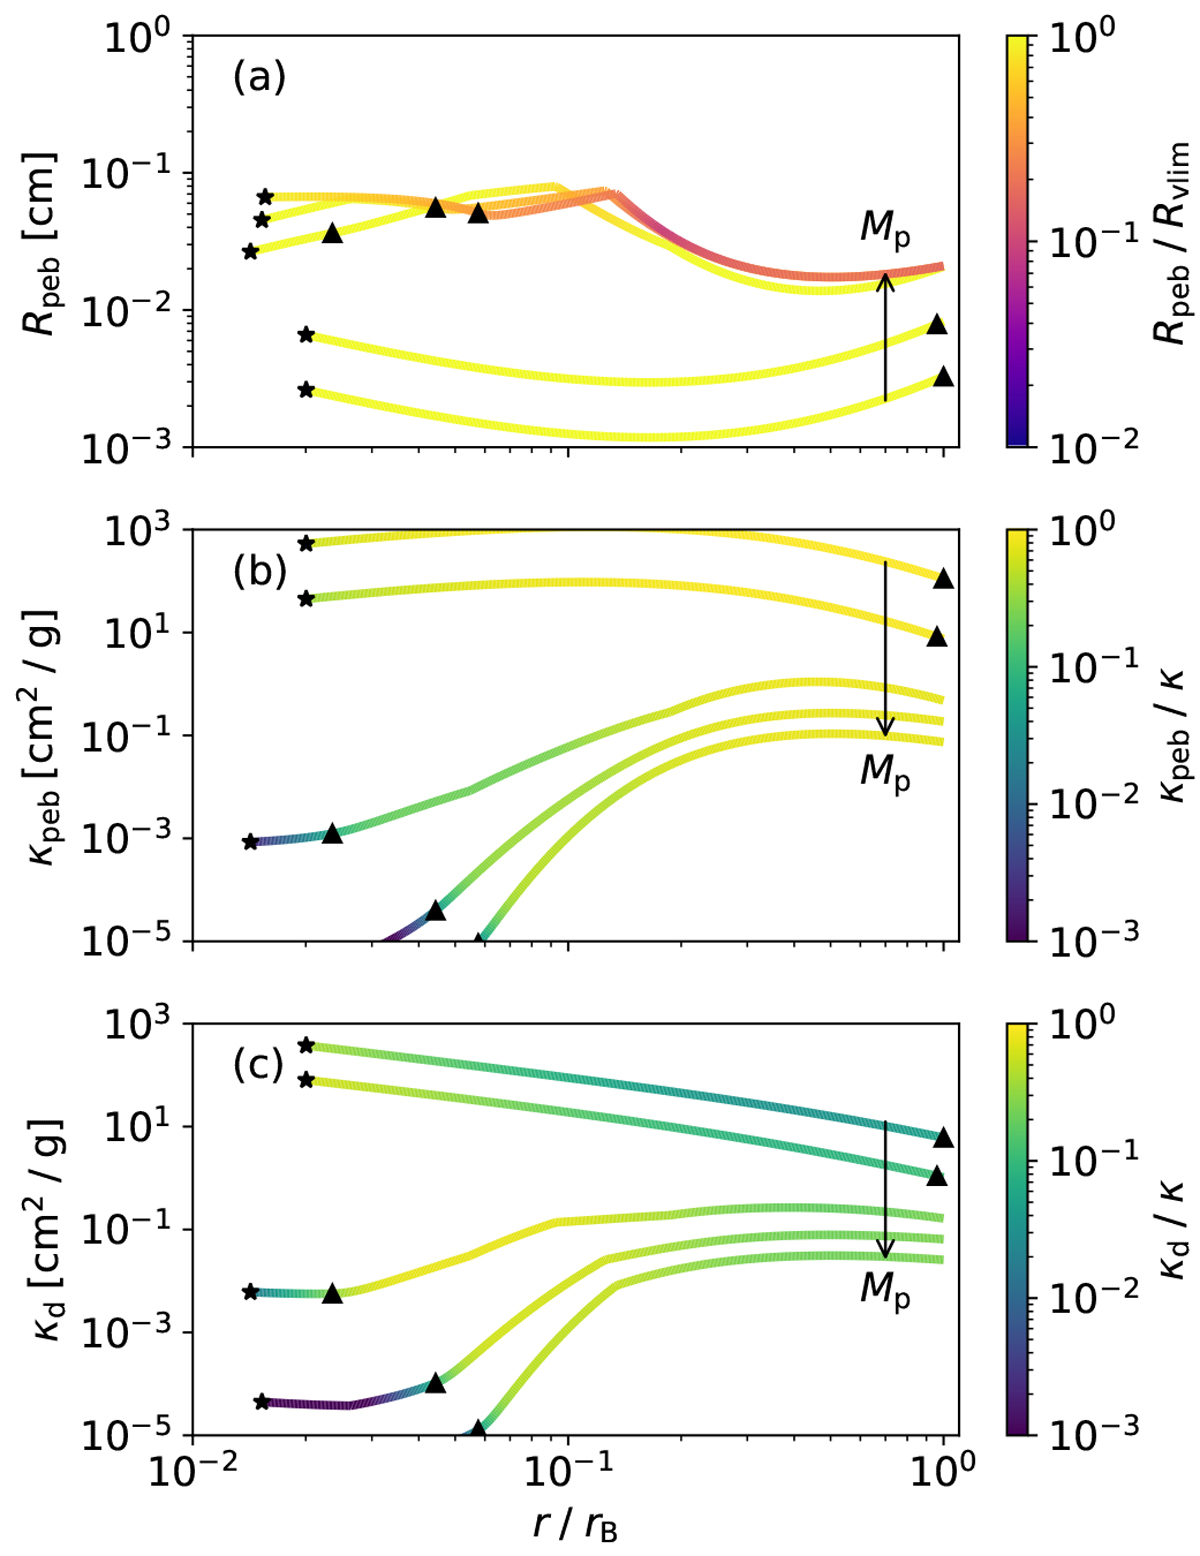
Pebble growth tracks (a), their resulting pebble opacity (b), and produced dust opacity (c) for a standard set of model runs at 5 AU (see Table 1). The different lines indicate a range of planet masses, with the arrow indicating a logarithmic progression from 0.5− 20 M⊕. The triangles indicate the location of the RCB, while the stars indicate the depth where the ambient temperature exceeds the sublimation temperature (2500 K) and the opacity from solids vanishes. The colors in the top panel show the ratio of the pebble size in the model relative to Rvlim (Eq. (14)). The colors in the two lower panels show the relative value of the indicated opacity to the total opacity.
Current usage metrics show cumulative count of Article Views (full-text article views including HTML views, PDF and ePub downloads, according to the available data) and Abstracts Views on Vision4Press platform.
Data correspond to usage on the plateform after 2015. The current usage metrics is available 48-96 hours after online publication and is updated daily on week days.
Initial download of the metrics may take a while.