Fig. 7.
Download original image
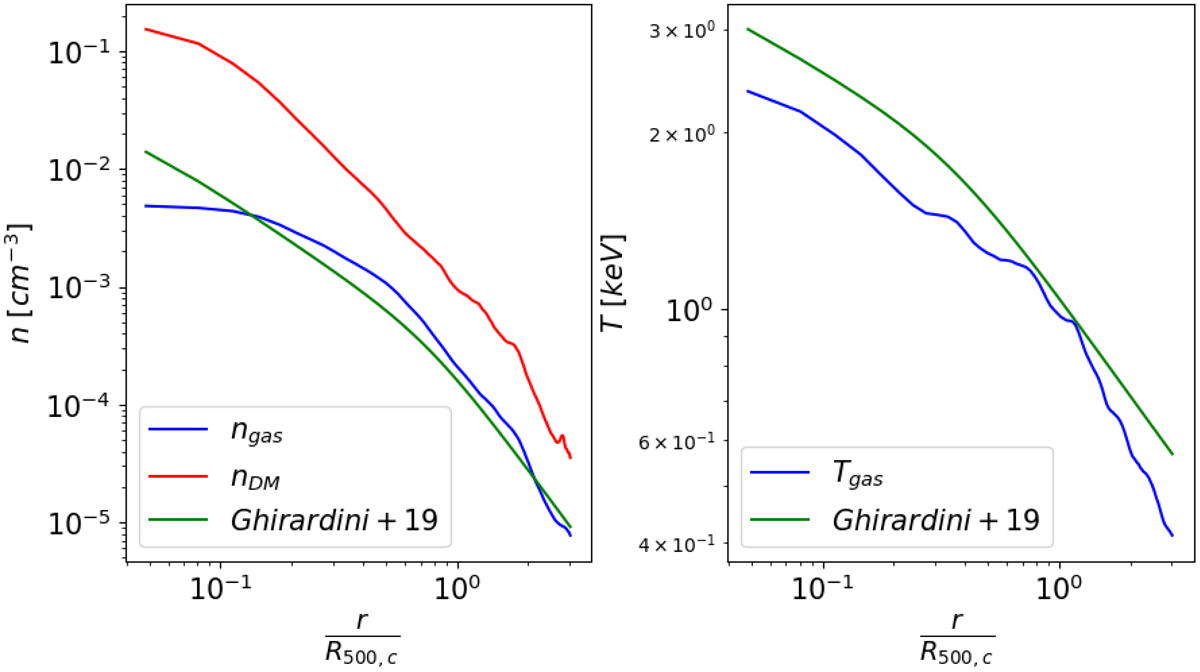
Comparison between density and temperature profiles of the simulated cluster IT90_2 (MTot, 500, c = 6.68 × 10¹³ M⊙, R500, c = 555 kpc, z = 0.1) and the universal profile proposed by Ghirardini et al. (2019). Left: Gas density (blue), dark matter density (red) and universal (green) profiles in cm−3 units. Right: Gas temperature (blue) and universal (green) profiles in keV units. In both panels the profiles are computed from the cluster’s center out to 3 ⋅ R500, c
Current usage metrics show cumulative count of Article Views (full-text article views including HTML views, PDF and ePub downloads, according to the available data) and Abstracts Views on Vision4Press platform.
Data correspond to usage on the plateform after 2015. The current usage metrics is available 48-96 hours after online publication and is updated daily on week days.
Initial download of the metrics may take a while.