Free Access
Fig. 6.
Download original image
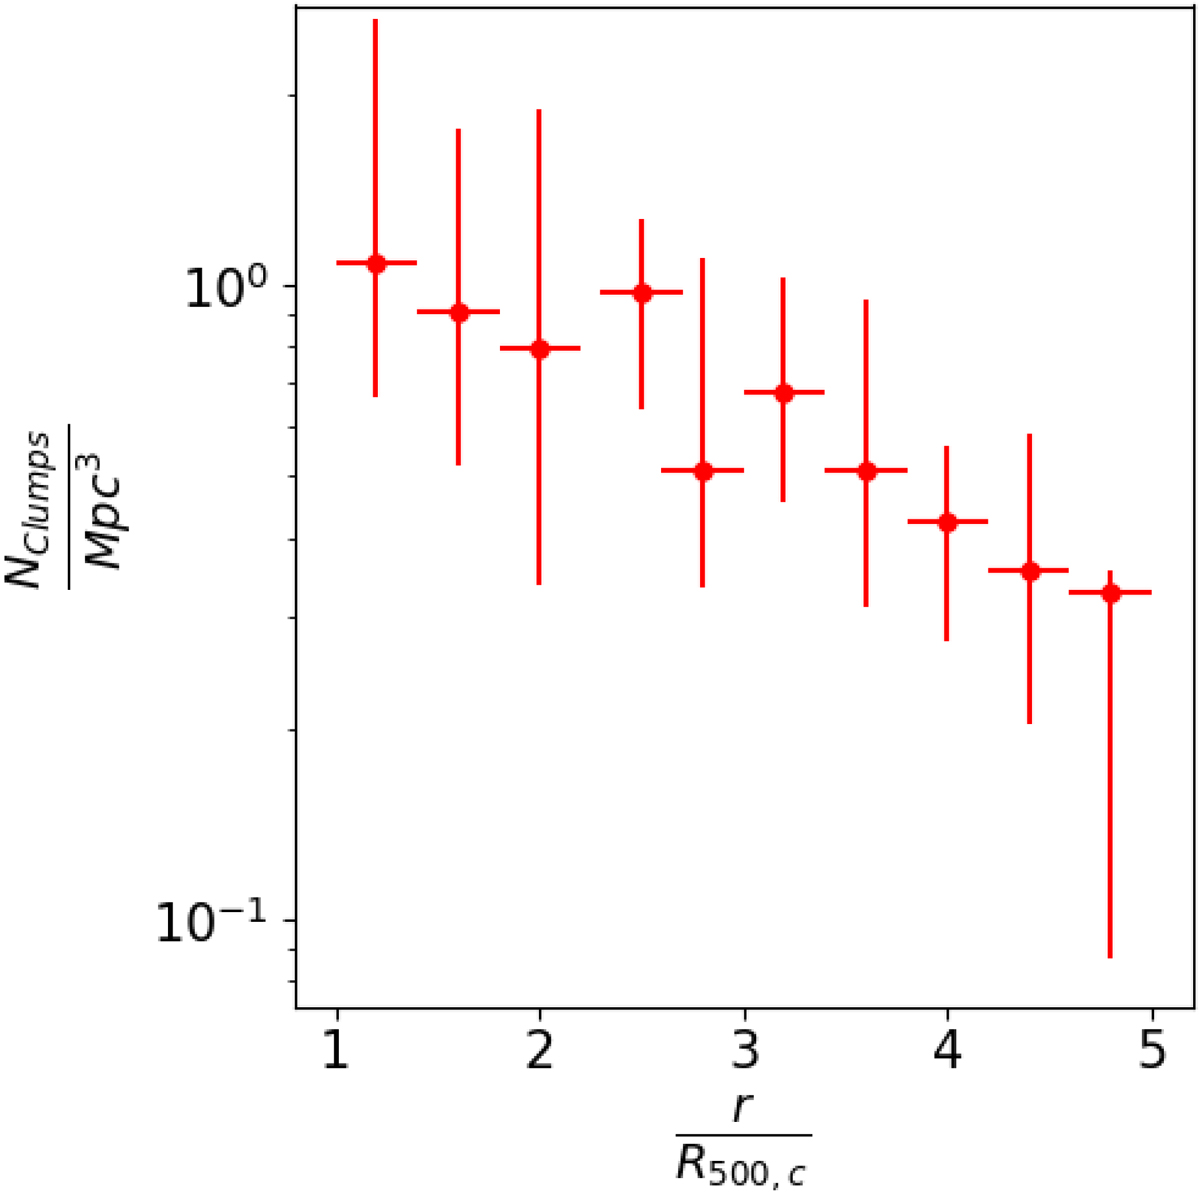
Number density of clumps computed on ten radial bins between R500, c and 5 ⋅ R500, c. The red dots are the median clumps’ number density in each bin. The x-axis errors represent the length of radial bins, while the y-axis ones represent the 16th and 84th percentiles of the bin’s number density distribution.
Current usage metrics show cumulative count of Article Views (full-text article views including HTML views, PDF and ePub downloads, according to the available data) and Abstracts Views on Vision4Press platform.
Data correspond to usage on the plateform after 2015. The current usage metrics is available 48-96 hours after online publication and is updated daily on week days.
Initial download of the metrics may take a while.