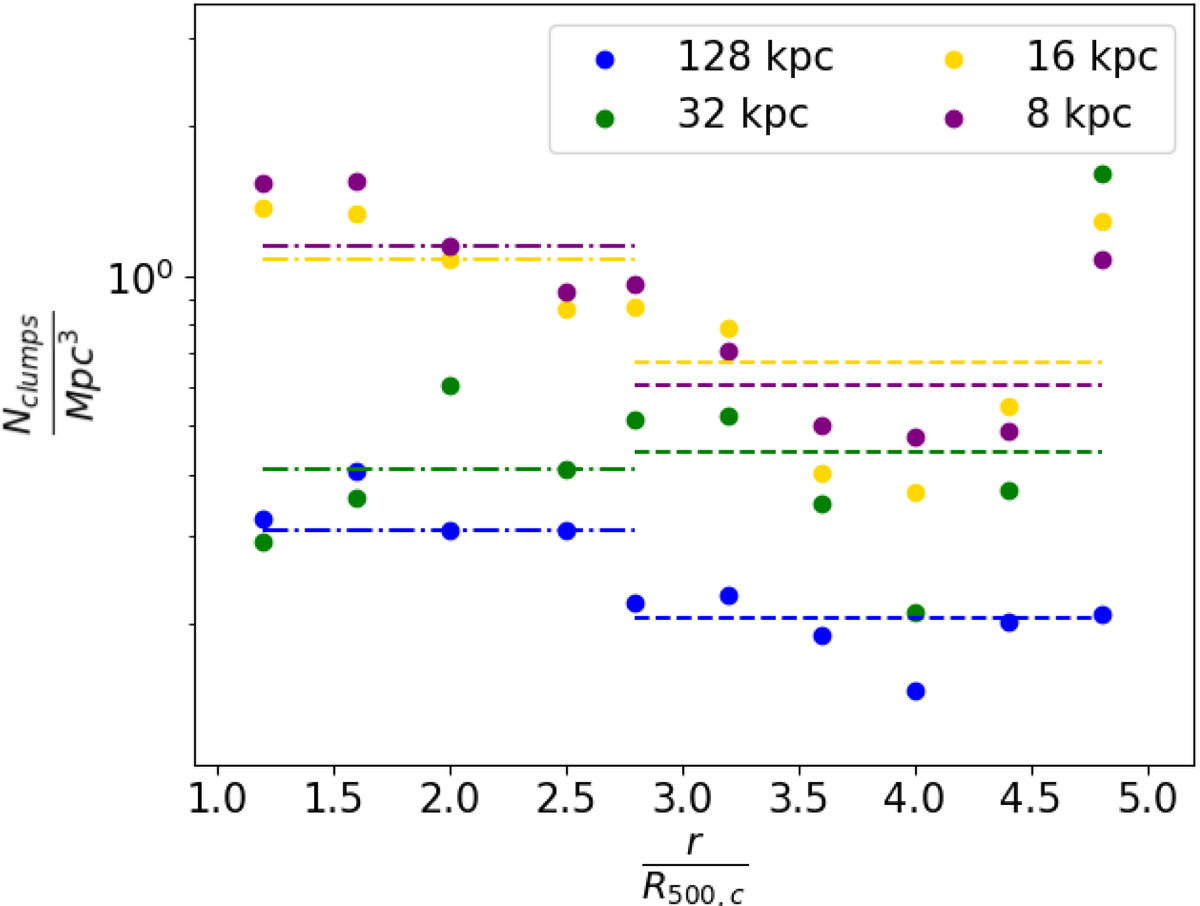
Fig. A.3.
Download original image
Clumps’ number density for the same cluster at different levels of numerical resolution in function of radial distance from the cluster’s center. The dot-dashed lines represent the median value computed between R500, c and 2.5 ⋅ R500, c, while the dashed ones represent the median value computed from 2.5 ⋅ R500, c to 5 ⋅ R500, c. The color-coding of these lines is the same adopted for the dots.
Current usage metrics show cumulative count of Article Views (full-text article views including HTML views, PDF and ePub downloads, according to the available data) and Abstracts Views on Vision4Press platform.
Data correspond to usage on the plateform after 2015. The current usage metrics is available 48-96 hours after online publication and is updated daily on week days.
Initial download of the metrics may take a while.