Fig. 7
Download original image
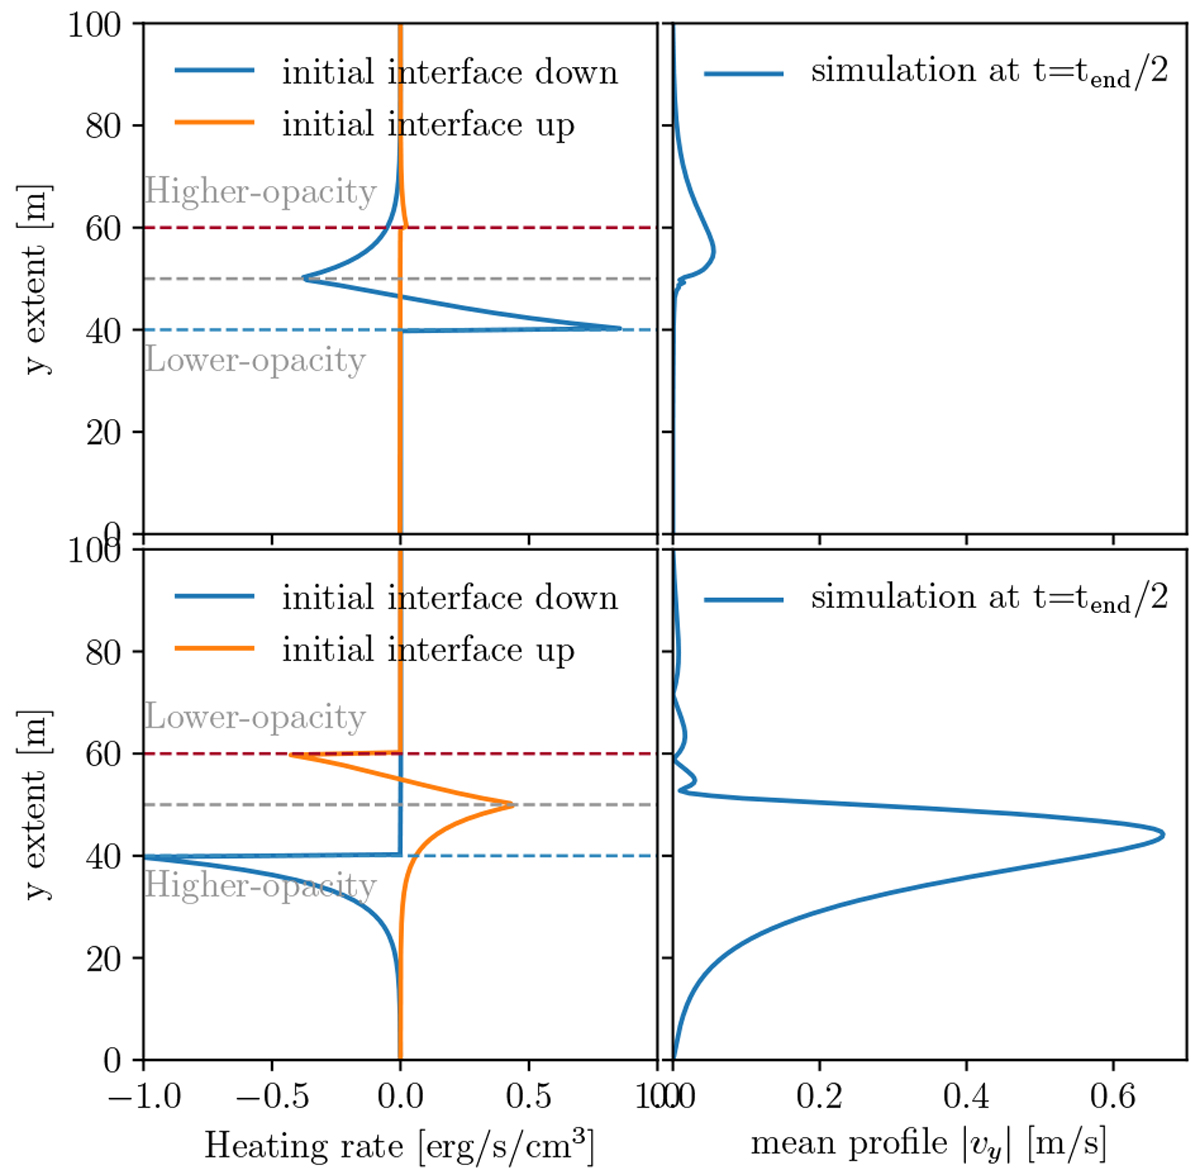
Earth-like regime with a negative vertical temperature gradient. Top: higher-opacity over lower-opacity. Bottom: lower-opacity over higher-opacity. Left: heating rate profiles when the position of the interface is displaced up or down by 10% from the initial condition. Right: mean vertical velocity profile in the simulation at t = tend ∕2.
Current usage metrics show cumulative count of Article Views (full-text article views including HTML views, PDF and ePub downloads, according to the available data) and Abstracts Views on Vision4Press platform.
Data correspond to usage on the plateform after 2015. The current usage metrics is available 48-96 hours after online publication and is updated daily on week days.
Initial download of the metrics may take a while.