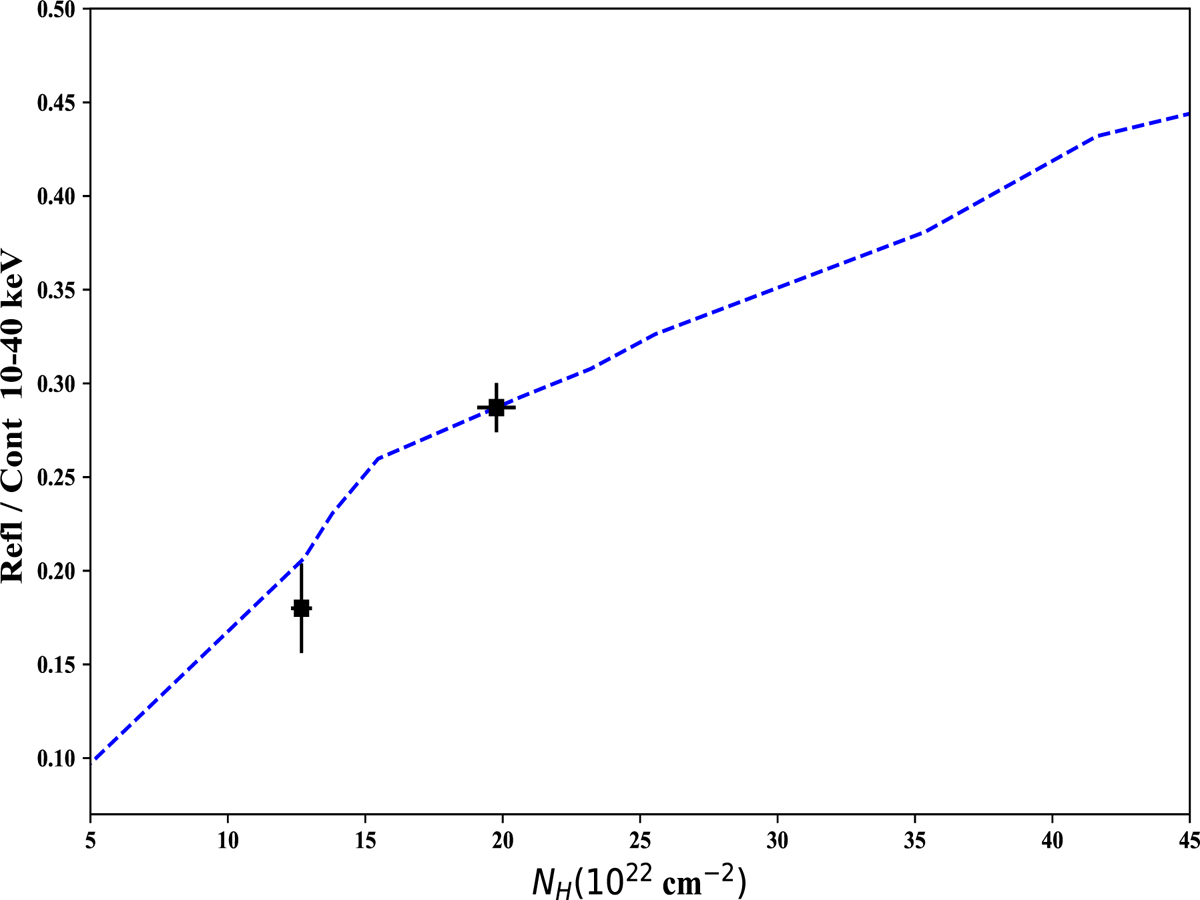
Fig. 9.
Download original image
Fraction of reflected over continuum emission from 10 to 40 keV as a function of absorption. The y values of the black points were estimated as the average reflection fraction of the individual MYTorus best-fit results. The blue dashed line denotes the predicted fraction in the case of a clumpy torus, as estimated by RefleX. The small break at NH ≃ 14 × 1022 cm−2 is probably due to computational noise.
Current usage metrics show cumulative count of Article Views (full-text article views including HTML views, PDF and ePub downloads, according to the available data) and Abstracts Views on Vision4Press platform.
Data correspond to usage on the plateform after 2015. The current usage metrics is available 48-96 hours after online publication and is updated daily on week days.
Initial download of the metrics may take a while.