Free Access
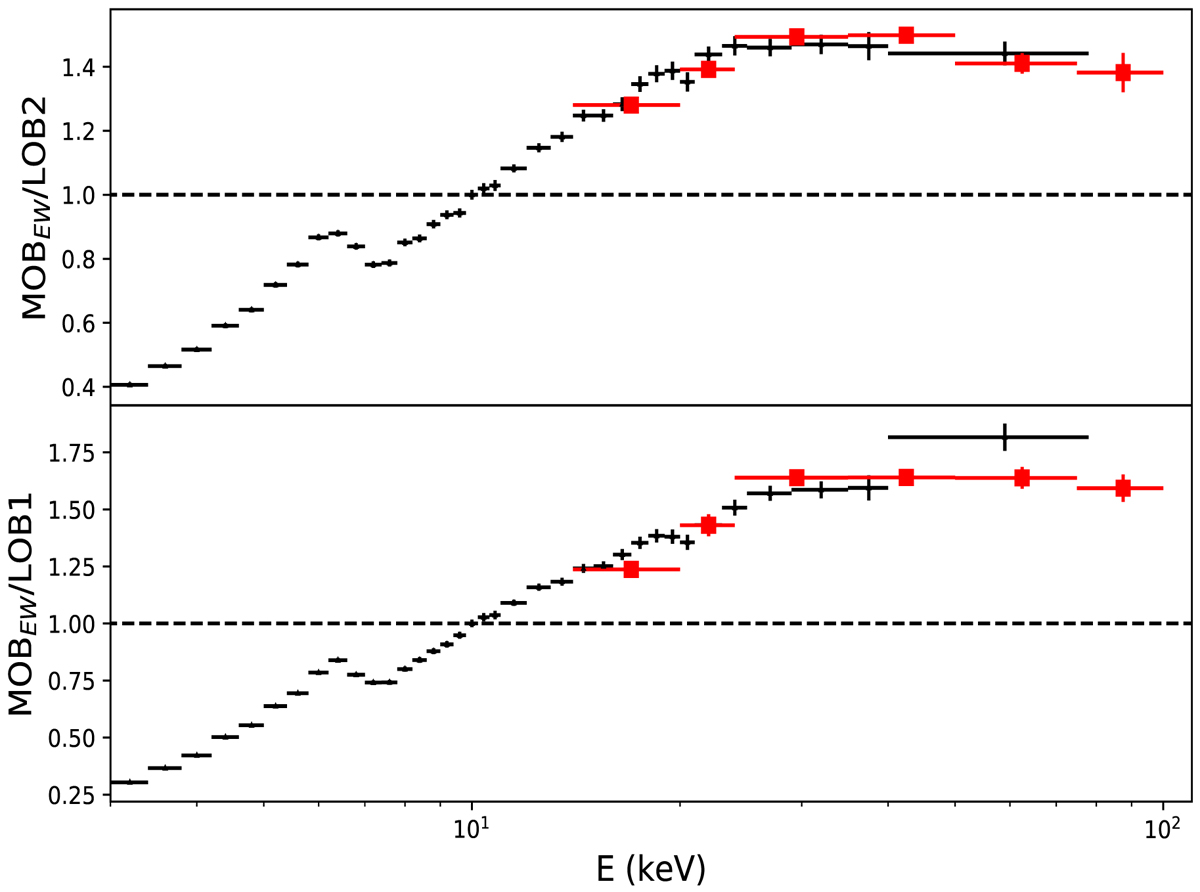
Fig. 10.
Download original image
Spectral ratio between the average spectra of MOBEW16 over LOB1 (lower) and LOB2 (upper panel) classes, as these were defined in Esposito & Walter (2016). The black points correspond to the NuSTAR ratio and the red squares denote the BAT results. The horizontal dashed line indicates the y = 1 line.
Current usage metrics show cumulative count of Article Views (full-text article views including HTML views, PDF and ePub downloads, according to the available data) and Abstracts Views on Vision4Press platform.
Data correspond to usage on the plateform after 2015. The current usage metrics is available 48-96 hours after online publication and is updated daily on week days.
Initial download of the metrics may take a while.