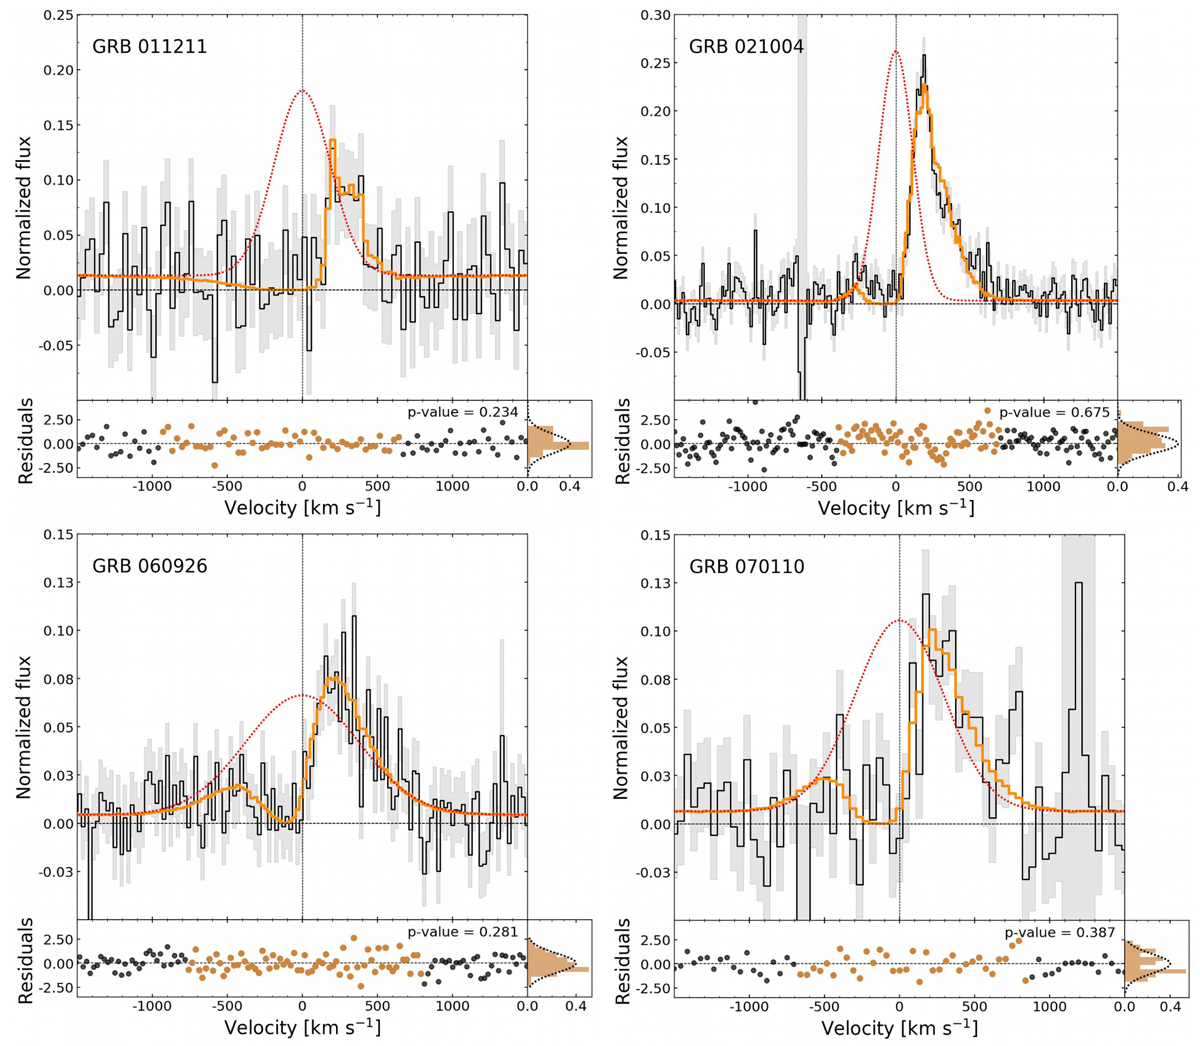
Fig. 9.
Download original image
Best fit of the Lyα line obtained by the unconstrained shell model. For each LGRB host, we show in the top panels the data (solid black line) with their error bars (grey), the best fit (dashed orange line), and the intrinsic Lyα emission predicted by the models (dotted red line). Bottom panels: the dots correspond to the normalized residuals between the observation and the model, and brown dots show the residuals covering the fitted Lyα line. The distribution of the residuals is projected in the right bottom panels. We also superimpose a Gaussian distribution with μ = 0 and σ = 1 (dotted black line) as a reference for comparison. The p-values correspond to the Shapiro-Wilk test.
Current usage metrics show cumulative count of Article Views (full-text article views including HTML views, PDF and ePub downloads, according to the available data) and Abstracts Views on Vision4Press platform.
Data correspond to usage on the plateform after 2015. The current usage metrics is available 48-96 hours after online publication and is updated daily on week days.
Initial download of the metrics may take a while.