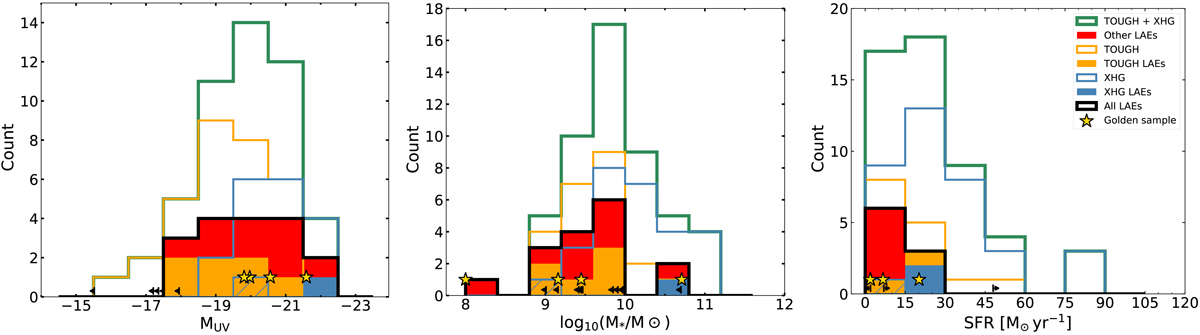
Fig. 5.
Download original image
Distribution of the MUV (left panel), stellar masses (middle panel), and SFR (right panel) of the overall LAE-LGRBs (solid black line). The colored areas inside the black histogram correspond to the LAEs detected in the TOUGH (yellow), XHG (blue), and other LAE-LGRBs outside these two samples (red). The dashed blue area shows GRB 070110, which is detected in the TOUGH and XHG samples both. The colored areas are cumulative and not superimposed. The overall TOUGH and XHG distributions are represented by the yellow and blue empty histograms, respectively. The green histogram is the sum of the TOUGH and XHG samples. The arrows represent limits, and the yellow stars are for the golden sample presented in Sect. 3.
Current usage metrics show cumulative count of Article Views (full-text article views including HTML views, PDF and ePub downloads, according to the available data) and Abstracts Views on Vision4Press platform.
Data correspond to usage on the plateform after 2015. The current usage metrics is available 48-96 hours after online publication and is updated daily on week days.
Initial download of the metrics may take a while.