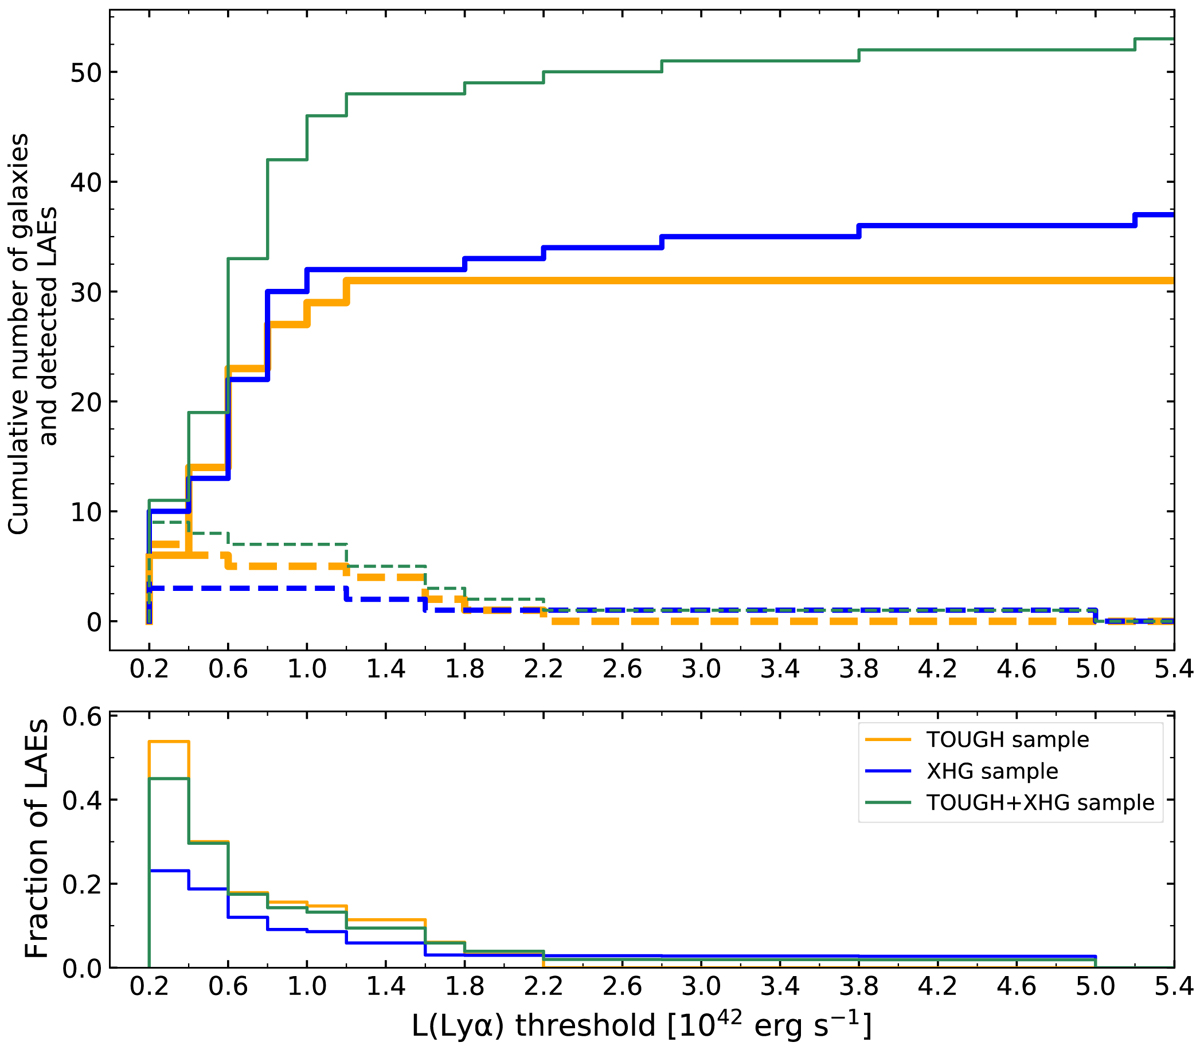
Fig. 2.
Download original image
Statistics of Lyα detection in LGRB host galaxy samples. Top panel: cumulative number of galaxies in the TOUGH (orange line), XHG (blue line), and merged samples (TOUGH+XHG, green) without overlapping GRBs as a function of Lyα luminosity detection threshold (3σ) of the spectra. The dashed lines represent the number of detected LAEs above the Lyα luminosity threshold in each sample. Bottom panel: fraction of detected LAEs for each sample as a function of Lyα luminosity threshold.
Current usage metrics show cumulative count of Article Views (full-text article views including HTML views, PDF and ePub downloads, according to the available data) and Abstracts Views on Vision4Press platform.
Data correspond to usage on the plateform after 2015. The current usage metrics is available 48-96 hours after online publication and is updated daily on week days.
Initial download of the metrics may take a while.