Fig. 12.

Download original image
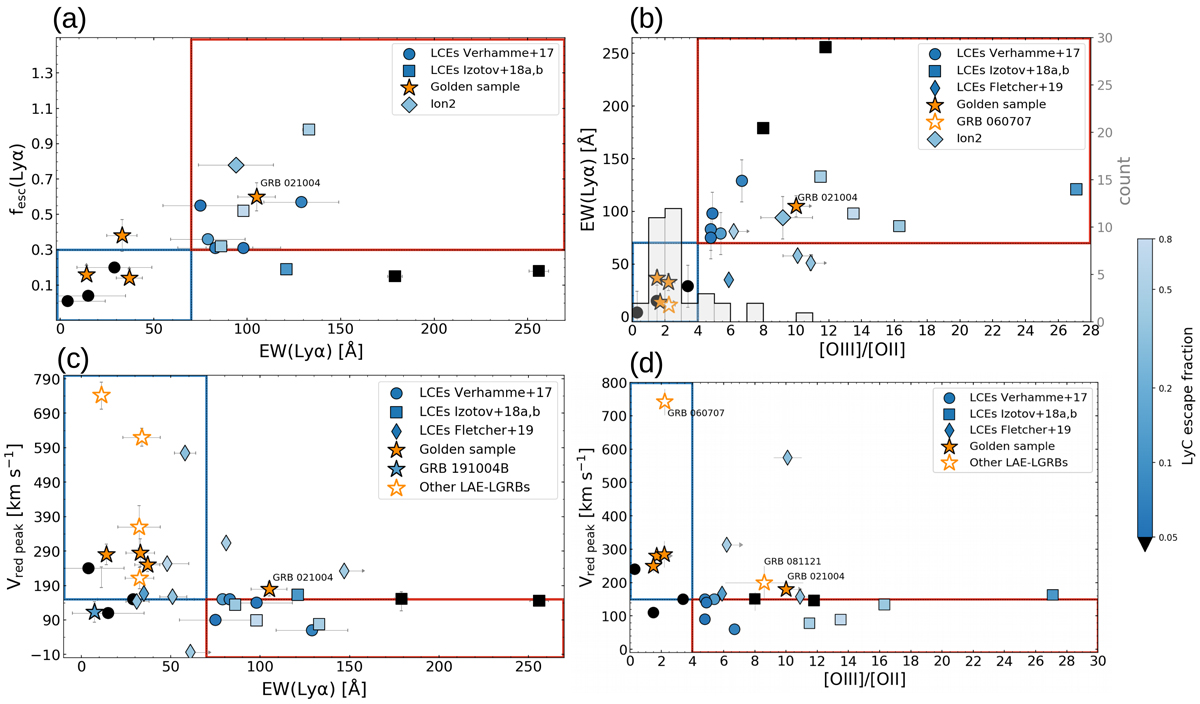
Comparison of the properties of the four LAE-LGRBs from the golden sample (orange stars) to other LAE-LGRBs and Lyman continuum emitters (LCEs) reported in Verhamme et al. (2017), Izotov et al. (2018a,b), and Fletcher et al. (2019). The white stars with orange contours represent LAE-LGRBs for which information on indirect indicators is available. The color bar codes the fesc(LyC) of the LCEs. In the four panels the blue rectangle represents the space parameter of low LyC leakage (fesc(LyC) < 5%), while the red rectangle marks the space parameter of high LyC leakage (fesc(LyC) > 5%), as defined by Verhamme et al. (2017). Panel a: escape fraction of Lyα photons as a function of the rest-frame Lyα EW. Panel b: correlation between the rest-frame Lyα EW and the [OIII]/[OII] ratio. The distribution of [OIII]/[OII] ratio for the LGRB host galaxies from Krühler et al. (2015) is also superimposed. Panel c: relation between the Lyα red peak velocity shift and the rest-frame Lyα EW. Panel d: correlation between the Lyα red peak velocity shift and the [OIII]/[OII] ratio.
Current usage metrics show cumulative count of Article Views (full-text article views including HTML views, PDF and ePub downloads, according to the available data) and Abstracts Views on Vision4Press platform.
Data correspond to usage on the plateform after 2015. The current usage metrics is available 48-96 hours after online publication and is updated daily on week days.
Initial download of the metrics may take a while.


