Fig. 11.
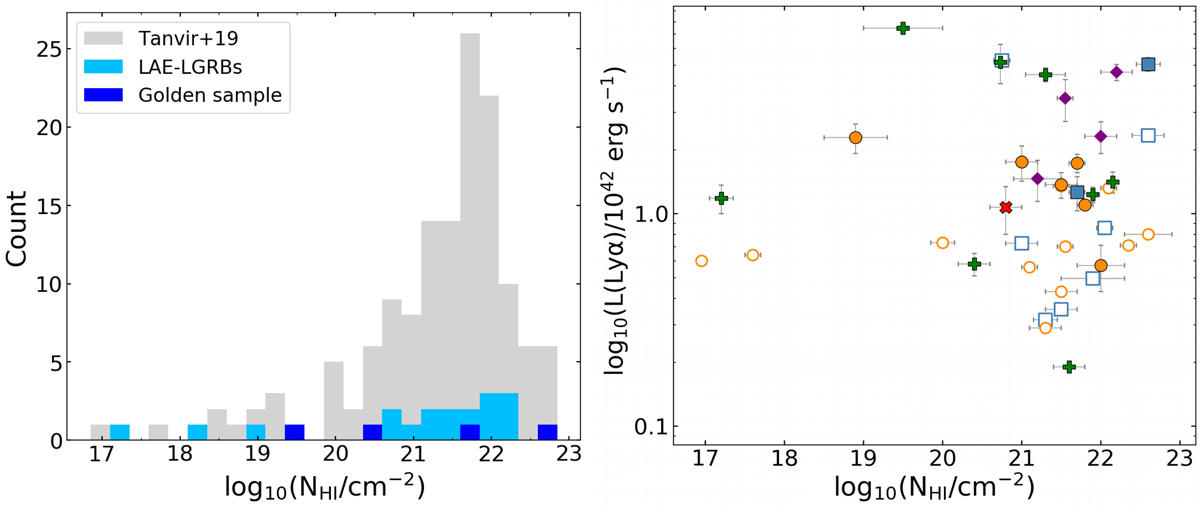
Download original image
Lyα emission and NHI values in LGRB host galaxies. Left panel: NHI distribution of the 140 LGRBs reported in Tanvir et al. (2019) (gray). The 22 of the 29 LAE-LGRBs that contain this information are shown in light blue, except for the GRB in the golden sample, which are represented in dark blue. The different histograms are superimposed and not cumulative. Right panel: Lyα luminosity distribution as function of NHI column density. The symbols are the same as in Fig. 1.
Current usage metrics show cumulative count of Article Views (full-text article views including HTML views, PDF and ePub downloads, according to the available data) and Abstracts Views on Vision4Press platform.
Data correspond to usage on the plateform after 2015. The current usage metrics is available 48-96 hours after online publication and is updated daily on week days.
Initial download of the metrics may take a while.