Fig. 6.
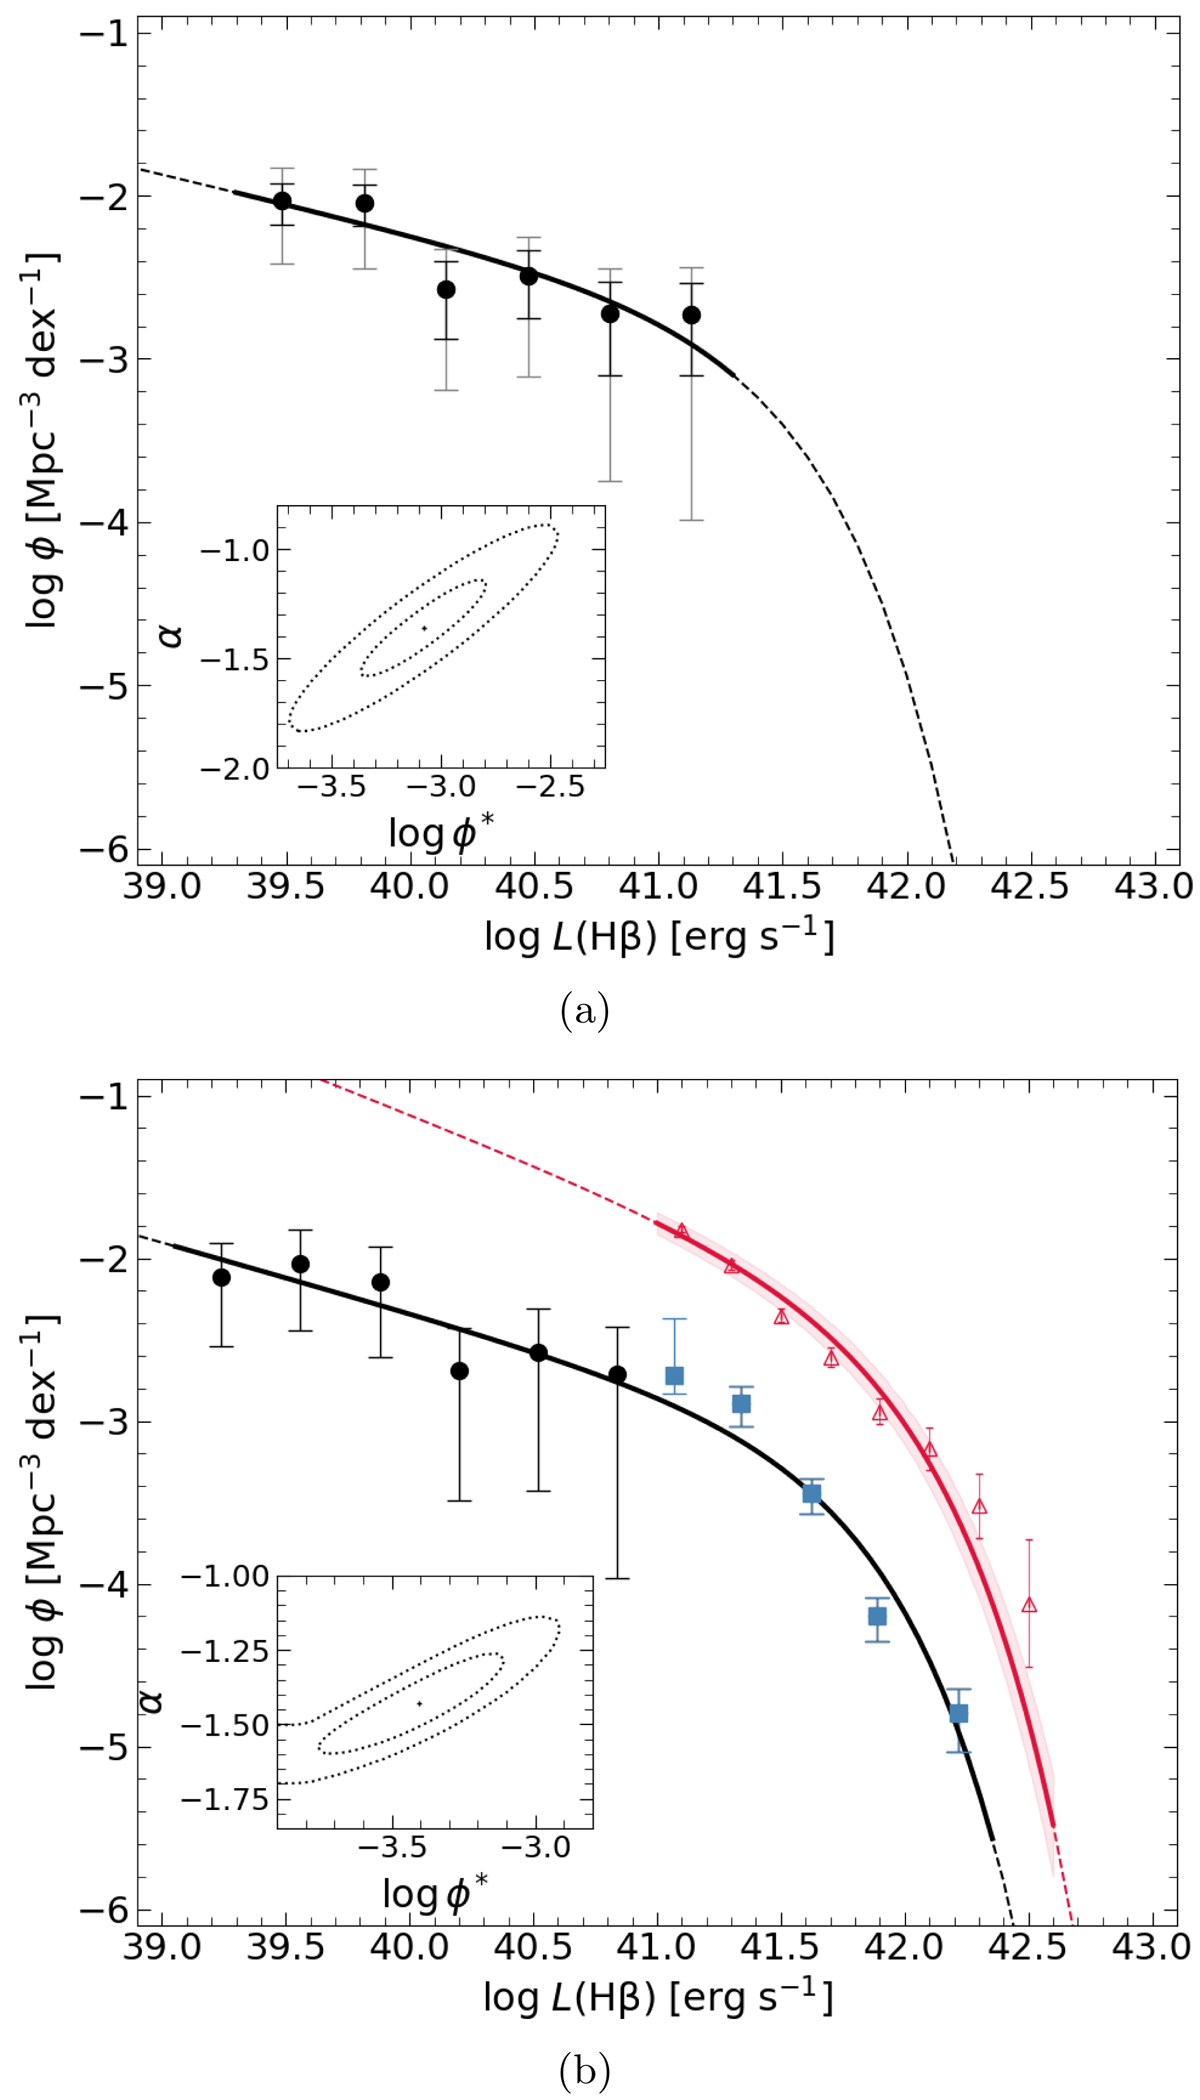
Download original image
Top figure: completeness and dust extinction-corrected Hβ LF at z ∼ 0.9. The black dots represent the Hβ sample and the black line shows the fitting of this sample. Shorter error bars represent the Poissonian error and the larger error bars have the rest of the uncertainties evenly added in quadrature (see text for details). Bottom figure: OTELO Hβ sample (black dots) complemented with high-luminosity data from Comparat et al. (2016) Hβ sample at z ∼ 0.8 (blue squares) fitted LF. Red triangles and the red line represent the literature data from the Hβ+[O III]λ4959,5007 sample by Khostovan et al. (2015) at z ∼ 0.8 and its LF fitting, respectively.
Current usage metrics show cumulative count of Article Views (full-text article views including HTML views, PDF and ePub downloads, according to the available data) and Abstracts Views on Vision4Press platform.
Data correspond to usage on the plateform after 2015. The current usage metrics is available 48-96 hours after online publication and is updated daily on week days.
Initial download of the metrics may take a while.