Fig. 5.
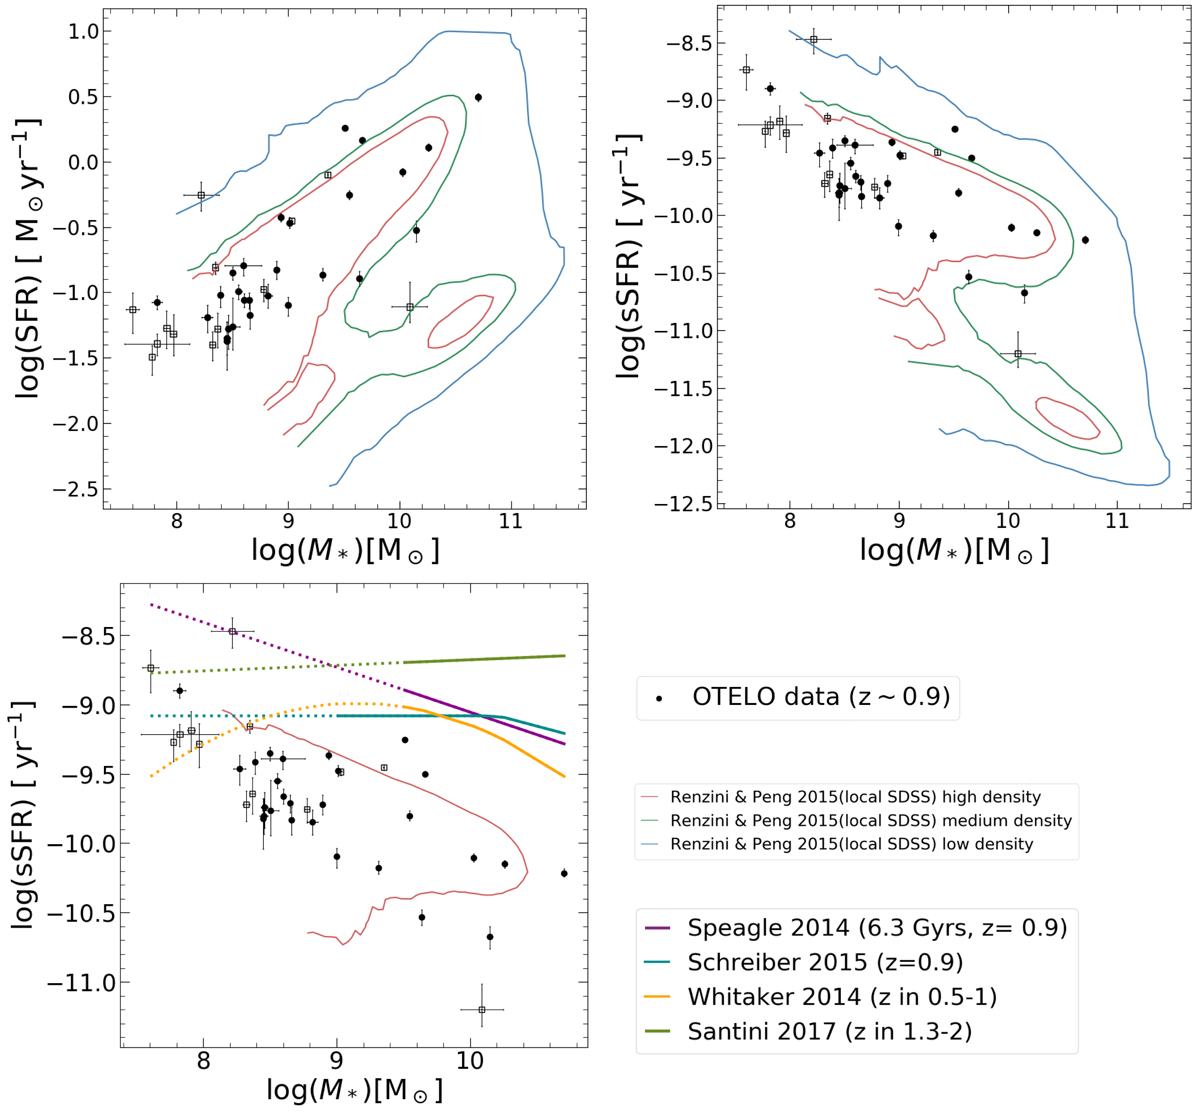
Download original image
Stellar masses as a function of SFR (top-left) and sSFR (top-right) for the Hβ sample. Disc and spheroid galaxies are indicated with empty yellow squares and empty grey circles, respectively. Contours correspond to the number density of galaxies from the SDSS database and obtained by Renzini & Peng (2015) at values of 1.2 × 10⁵ (red), 7.0 × 10⁴ (green), and 2.0 × 10⁴ (blue), clearly showing the position of the SF main sequence for local galaxies. We differentiate the robust sub-sample of 27 galaxies from the remaining 13 with black circles and empty black squares, respectively. The bottom-left plot clearly shows the local SF main sequence location (the red contour), where most of the galaxies in our sample are located. The plot also shows the different position of the SF main sequence given by different authors. For each MS, we differentiate the mass range used by each author from the extrapolated one by us by plotting the latter with a discontinuous line.
Current usage metrics show cumulative count of Article Views (full-text article views including HTML views, PDF and ePub downloads, according to the available data) and Abstracts Views on Vision4Press platform.
Data correspond to usage on the plateform after 2015. The current usage metrics is available 48-96 hours after online publication and is updated daily on week days.
Initial download of the metrics may take a while.