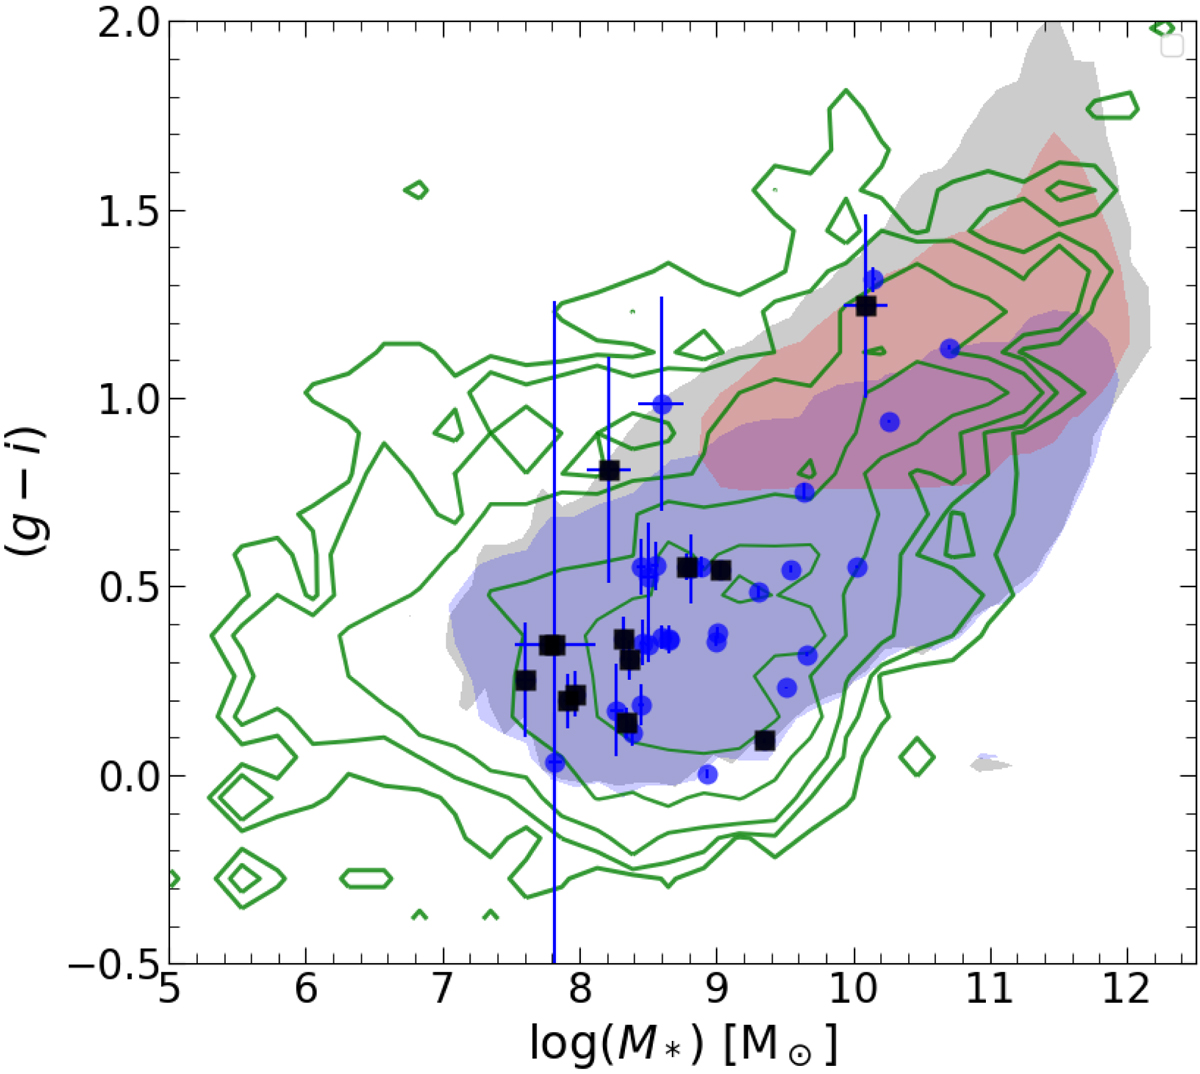
Fig. 4.
Download original image
Colour–M* diagram. Blue points show Hβ ELS and green contours represent the whole OTELO sample. The filled contour in grey shows the envelope of SDSS-DR7 data, while filled red and blue contours show red and blue clouds separated with the empirically estimated limit of Bluck et al. (2014). For the Hβ sample, we differentiate the robust sub-sample of 27 galaxies from the remaining 13 with blue circles and black squares, respectively.
Current usage metrics show cumulative count of Article Views (full-text article views including HTML views, PDF and ePub downloads, according to the available data) and Abstracts Views on Vision4Press platform.
Data correspond to usage on the plateform after 2015. The current usage metrics is available 48-96 hours after online publication and is updated daily on week days.
Initial download of the metrics may take a while.