Fig. 4
Download original image
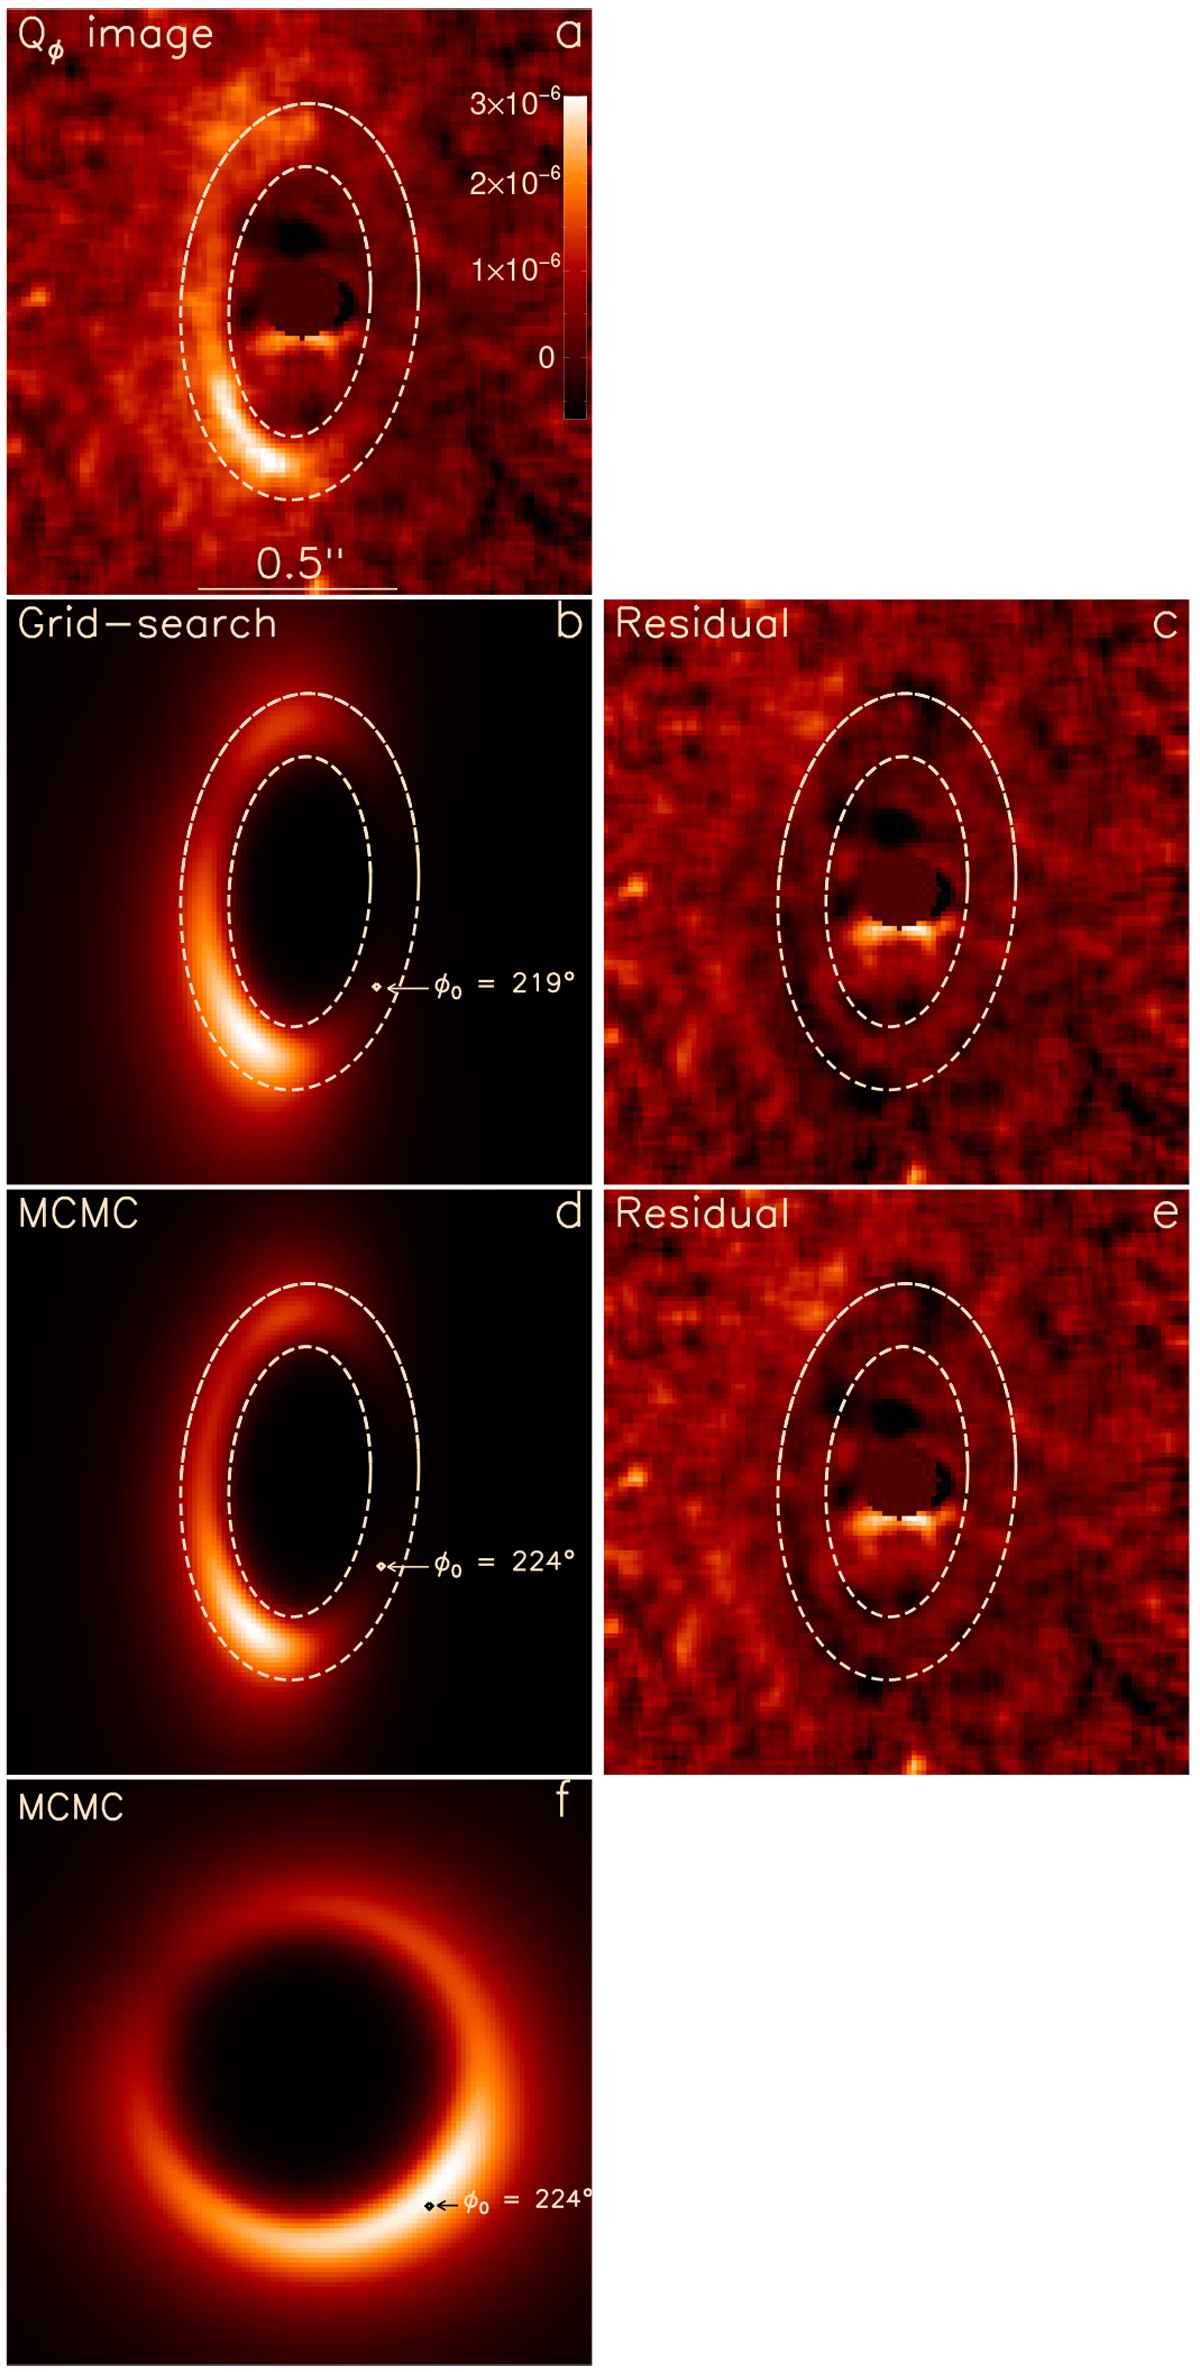
DPI data is displayed as a reference in the top row, together with the best-fit models (left) and the corresponding residuals (right) resulting from the grid-search (second row), and the MCMC (third row) analysis methods. Table 2 provides the parameters of the model for these two cases. The ellipses in dashed white lines show the aperture within which the reduced χ2 minimization has been performed. The bottom row shows the deprojected density function corresponding to the MCMC best-fit model.
Current usage metrics show cumulative count of Article Views (full-text article views including HTML views, PDF and ePub downloads, according to the available data) and Abstracts Views on Vision4Press platform.
Data correspond to usage on the plateform after 2015. The current usage metrics is available 48-96 hours after online publication and is updated daily on week days.
Initial download of the metrics may take a while.